
Hierarchical grouping of external features
Source:R/api-hierarchical-clustering.R
mfrm_cluster_hierarchical.RdFor new code use mfrm_cluster(..., method = "hierarchical").
The former method-specific entry is no longer exported. This guide retains
its statistical details and saved-result plotting methods.
Arguments
- x
For clustering, a table reviewed with
mfrm_features(). For plotting, anmfrm_hierarchical_clustersresult.- type
"dendrogram"(default),"silhouette", or"profile".- feature
A single selected feature name, required for
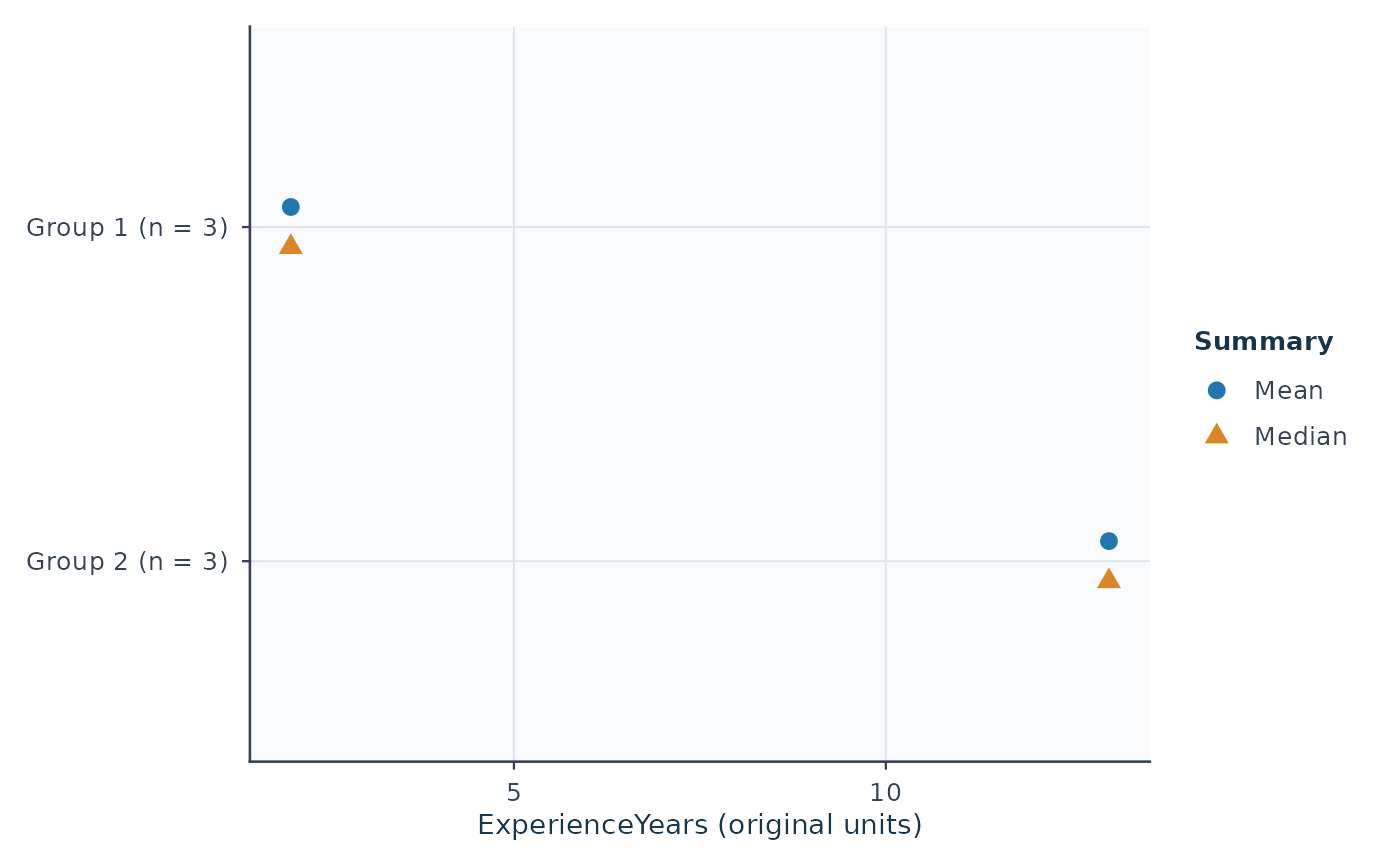
type = "profile". Numeric features show means and medians in their original units; categorical features show within-group proportions in the original level order (including unused factor levels).- labels
Whether to display entity IDs on dendrograms and silhouettes. The default labels at most 50 included entities. Hiding labels does not remove entities. Profile plots always label groups and levels.
- draw
Draw the plot when
TRUE;FALSEonly returns plotted values.- preset
Plot style:
"standard","publication","compact", or"monochrome".- ...
Reserved for future use; additional arguments are rejected.
Value
An mfrm_hierarchical_clusters object inheriting from mfrm_clusters.
It retains the hclust object in tree, ID-aligned membership (ID,
Cluster, Silhouette), cluster_summary, profiles, feature_data, and
settings including the linkage. Hierarchical clustering does not select
medoids; medoids is NULL and membership has no Medoid column.
summary() returns the size/silhouette table. plot() invisibly returns
a ggplot object; plot_data() extracts the tree, leaf order, memberships,
group count, and excluded IDs.
Details
Build an agglomerative hierarchy from weighted Gower dissimilarities, cut it into a chosen number of groups, and inspect the retained dendrogram.
Call mfrm_cluster(x, k, method = "hierarchical", linkage = "average").
The k, weights and missing controls follow mfrm_cluster().
linkage is "average" (default, UPGMA) or "complete". Average linkage
uses the mean dissimilarity over all cross-group pairs; complete linkage
uses their maximum. Neither is selected automatically from the data.
Uses stats::hclust() followed by stats::cutree() at the requested k.
Feature types, scaling, weights, missingness handling, silhouette definition,
and the 5,000-included-entity limit follow mfrm_cluster(). No distance
transformation or automatic sampling is performed. This limit is not a
memory or speed guarantee.
Only average and complete linkage are supported. Ward's minimum-variance criterion requires an appropriate Euclidean geometry; this mixed-feature Gower interface does not define a Euclidean conversion or a Ward analysis. Clustering MFRM bias estimates is a separate methodological question from grouping the external attributes accepted here. Measurement uncertainty is not propagated.
The tree is fitted independently of PAM. Its merge heights describe the
selected linkage on Gower dissimilarities, not significance or branch support.
Tied distances can produce alternative hierarchies and input order can affect
their resolution. A cut at k uses merge order even when heights tie, so a
horizontal height threshold need not uniquely identify that cut.
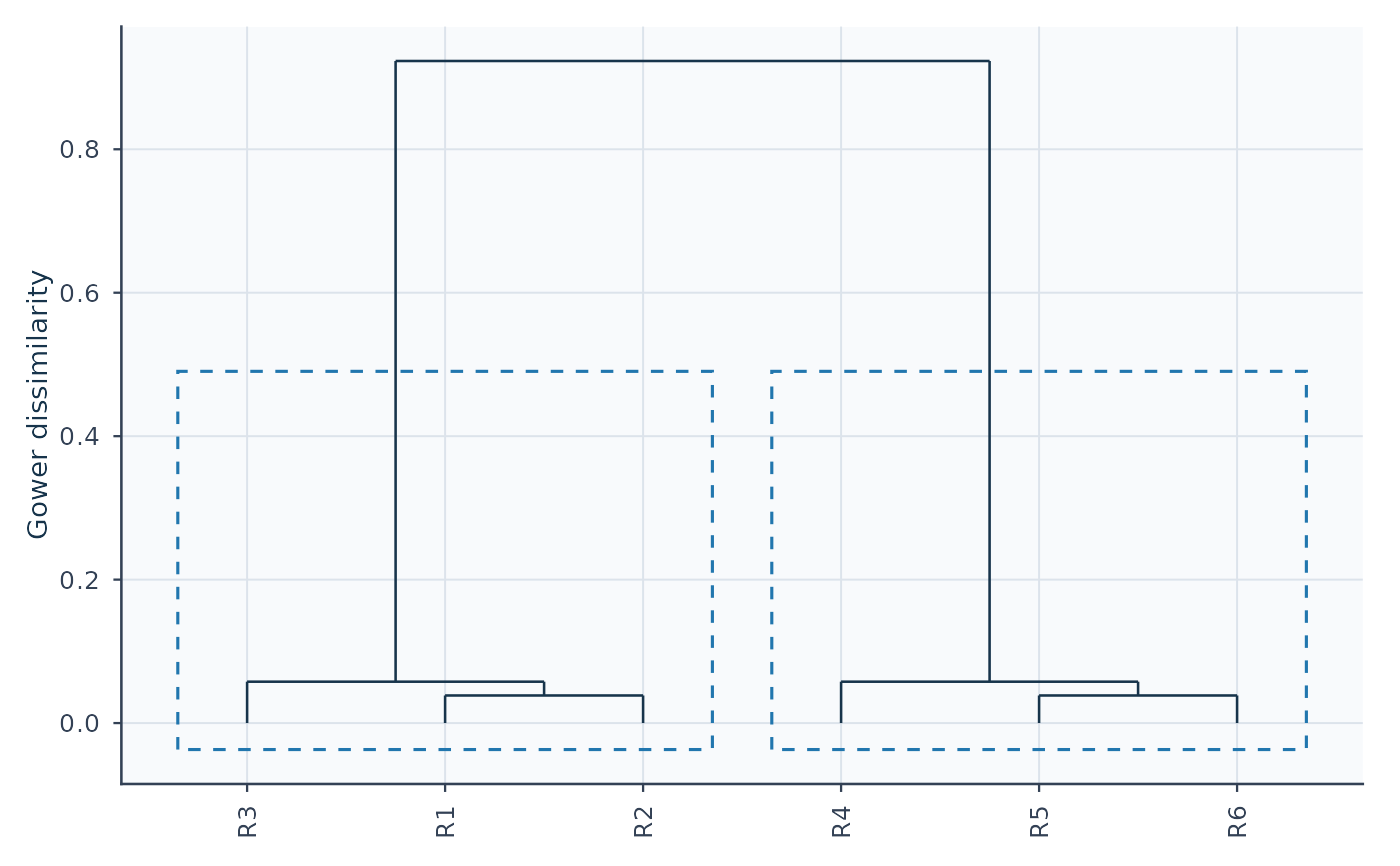
The default plot draws this stored tree, with boxes marking the stored k
groups. Labels are shown for at most 50 included entities by default; hiding
labels does not sample or remove entities. Excluded entities have no leaves
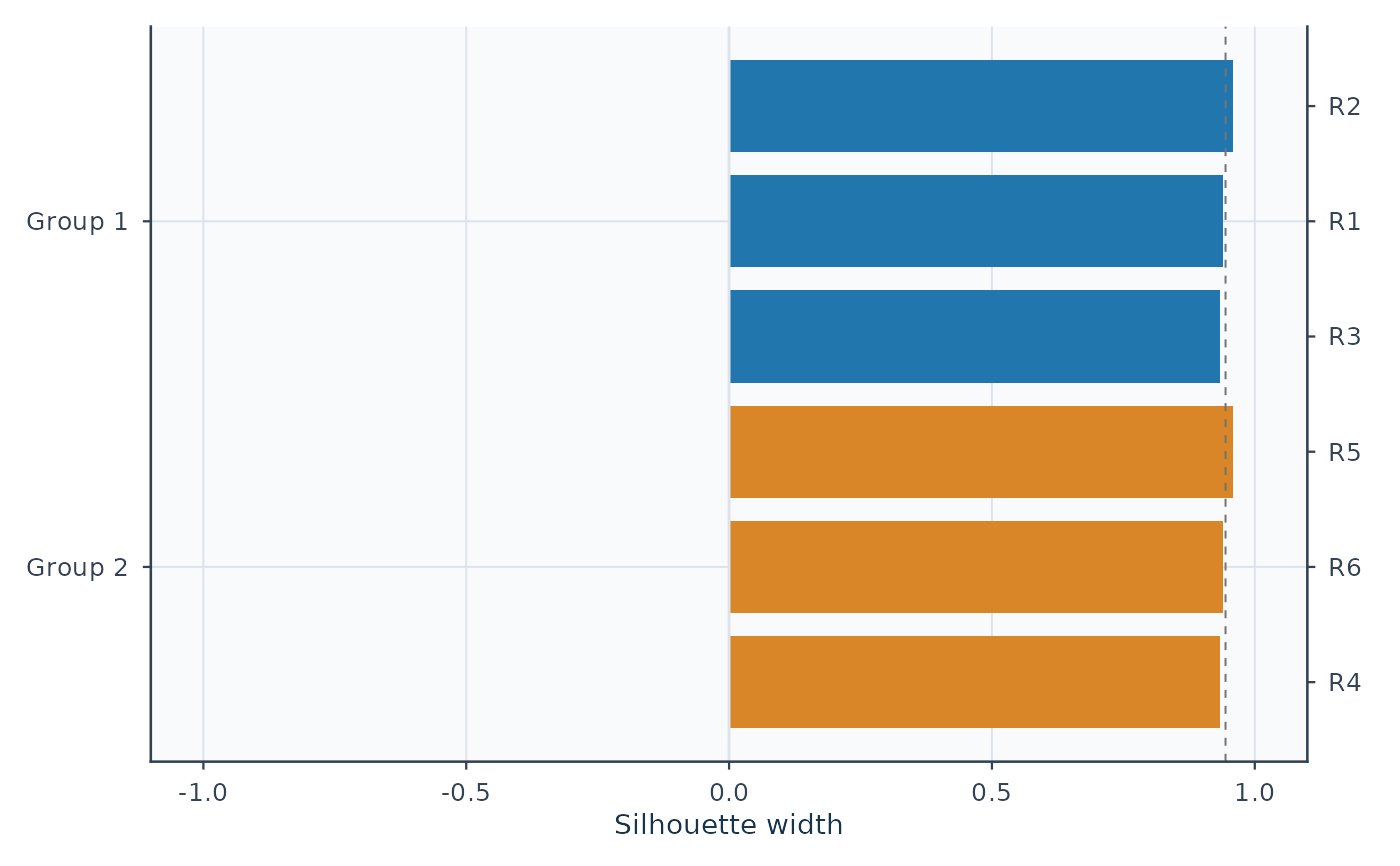
but remain in the result and plot data. Silhouette and feature-profile views
reuse plot.mfrm_clusters(). Plots do not refit or choose groups.
as_ggplot() converts the stored dendrogram without refitting. The default
and component = "tree" retain the full tree and group boxes. Leaf order,
heights, label settings and excluded IDs are preserved. Dashed boxes differ
from the solid tree branches even in monochrome. Box widths and
physical text sizes can differ from base graphics. Tied heights retain the
merge-order partition; boxes do not imply a unique horizontal height cut.
Use ggplot2::labs(title = NULL, subtitle = NULL, caption = NULL) to remove
headings and annotations, and plot_data() to inspect the retained source
evidence. Silhouette/profile conversions use the same dedicated summary
renderers as plot.mfrm_clusters().
Use mfrm_cluster_compare() to compare this partition with PAM or another
linkage on the same data. For multiple imputations, use
mfrm_cluster_imputed(..., method = "hierarchical", linkage = "average").
Each completion retains its own tree; no pooled tree or branch support is
estimated. See online feature-analysis guide.
Session plot defaults
See mfrmr_visual_diagnostics for options(mfrmr.plot_preset), argument
precedence, and appearance when saving or reusing a plot.
Reading clustering metrics
For entity i, a(i) is its mean dissimilarity to other members of its own group; b(i) is the smallest mean dissimilarity to any other group. Silhouette = (b - a) / max(a, b), between -1 and 1. Values near 1 indicate compact, separated placement in this fitted geometry; near zero indicates a boundary; negative values indicate closer average proximity to another group. A singleton receives 0 by convention; zero does not establish overlap. A zero denominator also receives 0. Overall means weight entities equally; cluster means use that cluster's included entities. Excluded IDs have NA. A silhouette is neither a membership probability nor evidence of stability.
Gower distance is unitless in [0, 1] here: numeric absolute differences
divided by included-sample ranges, nominal/binary mismatches, and ordinal
rank differences are combined using the specified feature weights.
The PAM medoid is an actual included entity minimizing within-group total
dissimilarity; it is not a feature-wise mean. Profile Mean/Median/SD retain
original units; categorical Proportion uses included group size as denominator.
A large group or a high silhouette is not a better-performing group.
Compare partitions under a fixed feature/distance definition; changing the
sample, weights or scaling changes what these numbers measure.
See cluster::silhouette() and Rousseeuw (1987),
doi:10.1016/0377-0427(87)90125-7
, for the silhouette definition.
References
Murtagh, F. and Legendre, P. (2014). Ward's Hierarchical Agglomerative Clustering Method: Which Algorithms Implement Ward's Criterion? Journal of Classification, 31, 274–295. doi:10.1007/s00357-014-9161-z .
Examples
if (requireNamespace("cluster", quietly = TRUE)) {
# Fictional rater backgrounds; R7 has unrecorded experience.
raters <- data.frame(Rater = paste0("R", 1:7),
ExperienceYears = c(1, 2, 3, 12, 13, 14, NA),
Specialty = factor(c(rep("Language", 3), rep("Science", 4))))
features <- mfrm_features(raters, "Rater", c("ExperienceYears", "Specialty"))
hierarchy <- mfrm_cluster(method = "hierarchical", features, k = 2, missing = "omit")
plot(hierarchy)
plot(hierarchy, type = "silhouette")
plot(hierarchy, type = "profile", feature = "ExperienceYears")
comparison <- mfrm_cluster_compare(list(
PAM = mfrm_cluster(method = "pam", features, k = 2, missing = "omit"),
Average = hierarchy,
Complete = mfrm_cluster(method = "hierarchical", features, k = 2,
linkage = "complete", missing = "omit")))
comparison$analysis_summary
summary(comparison)
}
 #> First Second Partitions Included Pairs MeanChangedFraction
#> 1 PAM Average 1 6 15 0
#> 2 PAM Complete 1 6 15 0
#> 3 Average Complete 1 6 15 0
#> MinChangedFraction MaxChangedFraction MeanAdjustedRand
#> 1 0 0 1
#> 2 0 0 1
#> 3 0 0 1