
Principal components of numeric external features
Source:R/api-numeric-features.R, R/api-plotting-pca.R
mfrm_pca.RdExpress numeric attributes as principal components: new variables ordered by
how much variation they describe. For example, summarize rater experience,
training and workload together. Choose components when you want to retain
fewer variables; the default retains all nonzero components. PCA does not
estimate rater quality, ability or groups. Identifiers and omitted rows are
retained.
Usage
mfrm_pca(
  x,
  components = NULL,
  scale = TRUE,
  weights = NULL,
  missing = c("error", "omit")
)

# S3 method for class 'mfrm_pca'
print(x, ...)

# S3 method for class 'mfrm_pca'
summary(object, ...)

# S3 method for class 'mfrm_pca'
plot(
  x,
  type = c("scree", "scores", "loadings"),
  components = NULL,
  groups = NULL,
  labels = NULL,
  marginal = c("auto", "histogram", "none"),
  draw = TRUE,
  preset = "standard",
  ...
)
Arguments
- x
-
For
mfrm_pca(): A table reviewed withmfrm_features(). Formfrm_cluster(..., method = "kmeans"), a result frommfrm_pca()is also accepted.For
plot(): A result frommfrm_pca(). - components
-
For
mfrm_pca(): Number of leading principal components to retain.NULLretains the numerical rank, usingsqrt(.Machine$double.eps)relative to the largest singular value. A requested count cannot exceed that rank.For
plot(): For scores, two distinct retained component numbers. For loadings, one retained component number. Defaults toc(1, 2)for scores and1for loadings. Unavailable axes cause an error. - scale
Divide centered numeric features by their sample standard deviations (
TRUE, default). WithFALSE, distances retain the original feature units. Numeric coding must have a meaningful Euclidean interpretation; factors, ordered factors, characters and logical features are refused.- weights
Optional named, strictly positive finite numeric vector with one weight per selected feature. Defaults to equal weights. Names, not vector order, identify features. Remove a feature to exclude it.
- missing
Either
"error"(default) or"omit". The latter excludes incomplete entities explicitly, retaining their IDs, reasons, and missing group membership in the result. No values are imputed.- ...
For
print(): Reserved for method compatibility. Forplot(): Reserved for future use; additional arguments are rejected.- object
An object returned by
mfrm_pca().- type
"scree"(default),"scores", or"loadings".- groups
Optional
mfrm_cluster()result used to color a scores plot. Its IDs, included entities and shared PCA features must match. Labels only annotate the view; they do not refit PCA or imply separation on every component. Groups use both colour and point shape, including monochrome output. Shapes repeat after six groups; inspect the ID-aligned table for crowded views.- labels
Whether to display entity IDs on silhouettes or heatmaps. The default displays them for at most 50 entities. No entities are sampled when labels are hidden. Profile plots always label groups and levels.
- marginal
Marginal histogram display for
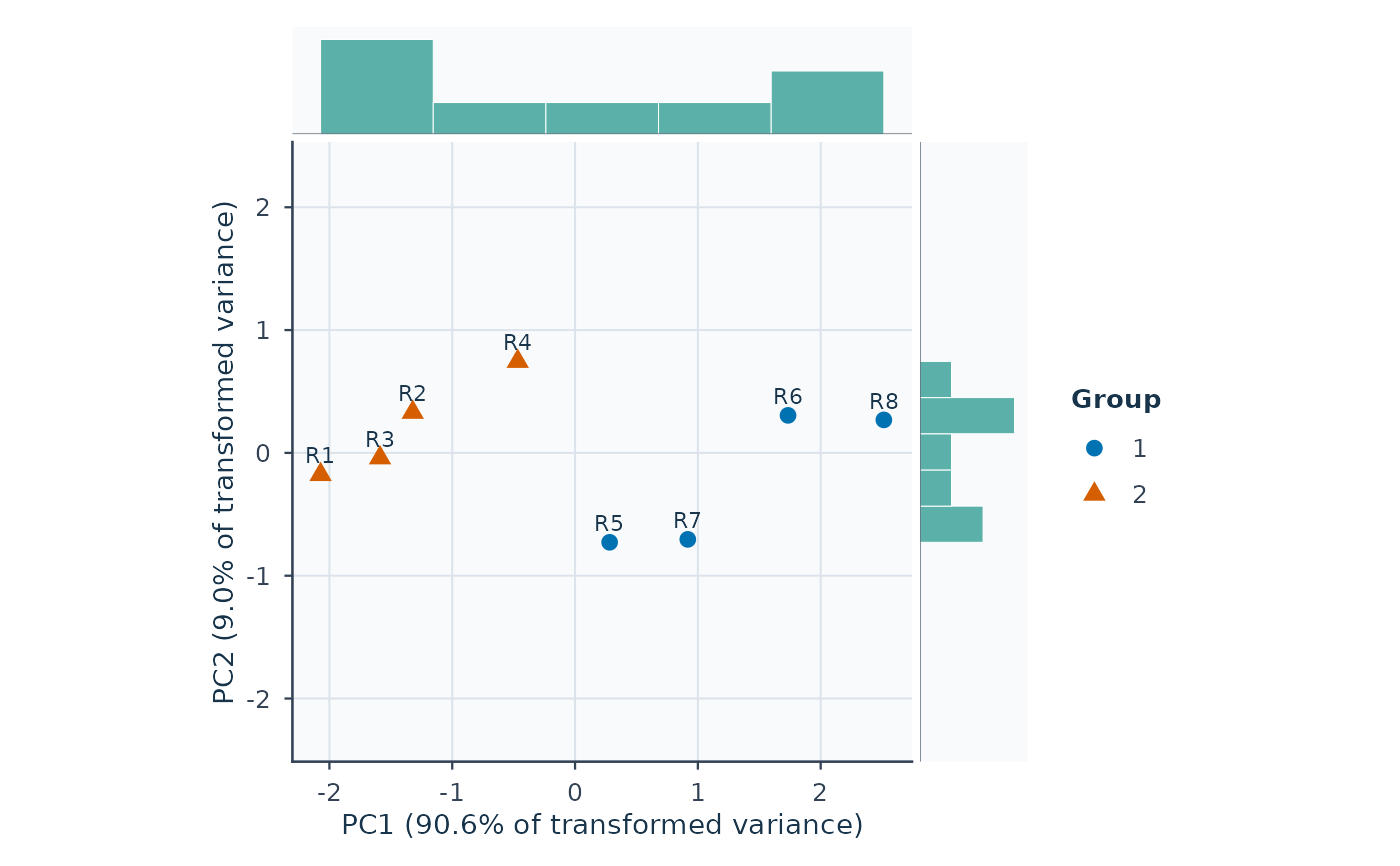
type = "scores":"auto"(default; displayed when at least 8 finite score pairs are plotted),"histogram", or"none".- draw
Draw the plot when
TRUE;FALSEonly returns plotted values.- preset
Plot style:
"standard","publication","compact", or"monochrome".
Value
An mfrm_pca object with ID-aligned scores (omitted rows are NA),
loadings, a variance table (variance, proportion, cumulative proportion
and retained status), transformation (centers, divisors and weight factors),
original feature_data and settings. summary() returns variance.
For plot(): Invisibly, a ggplot object carrying the underlying
mfrm_plot_data payload (accessible via plot_data()) with the exact plotted table,
selected components, group colour/shape encoding, excluded IDs and axis meanings. Scree data retain the
full variance table, including components not used for clustering.
plot_data() extracts these values. as_ggplot() converts all three views
using their saved axes and encodings; component = "table" retains the
complete view. Excluded IDs and transformation metadata remain attached.
Use ggplot2::labs(title = NULL, subtitle = NULL) to hide headings in
the returned ggplot. Labels follow the saved labels setting; no entities
are sampled when labels are hidden. Physical text and point sizes can
differ between base graphics and ggplot. Converted scores use equal axis
units and equal displayed spans to avoid a narrow panel when the selected
components explain very different amounts of variation.
Details
Uses stats::prcomp() on centered, optionally standardized features,
multiplied by sqrt(weights / max(weights)). Thus weights apply to
squared Euclidean distances. Weight names
identify original features. Constant features, nonfinite transformations
and numerically unrepresentable variance are refused. Missingness stops by
default; explicit omission retains every excluded ID and its original reason.
PCA finds directions of feature variance, not clusters or latent MFRM abilities. All nonzero components preserve distances in the transformed feature space, within numerical precision. Retaining fewer components changes the clustering objective and can remove informative directions. High explained variance does not establish valid groups. Signs of loadings and scores are arbitrary; tied eigenvalues can also rotate their subspace. Loadings are eigenvector coefficients in the transformed feature space, not correlations in the original units.
Use the same fitted PCA to review scores, loadings and groups. Passing its
result to mfrm_cluster(..., method = "kmeans") uses the retained scores without further
standardization or whitening. PCA is not a required step for k-means.
Group comparison and imputation sensitivity retain their descriptive scope.
plot() method: Plot numeric feature PCA and optional exploratory groups
Review explained variation, original-feature coefficients or entity scores from a saved PCA without refitting it.
For plot(): Scores and loading signs are arbitrary. Loadings are eigenvector
coefficients in the centered, weighted and optionally standardized space;
they are not original-unit correlations. A two-component scores view omits
other directions, so apparent overlap or separation is only a projection.
No confidence region, group validity or rater-quality judgment is implied.
Session plot defaults
See mfrmr_visual_diagnostics for options(mfrmr.plot_preset), argument
precedence, and appearance when saving or reusing a plot.
See also
k-means details, mfrm_cluster_compare(), plot.mfrm_pca(),
stats::prcomp()
mfrm_pca(), k-means details
Examples
raters <- data.frame(Rater = paste0("R", 1:8),
ExperienceYears = c(1, 2, 3, 4, 10, 12, 13, 15),
WorkshopHours = c(4, 12, 8, 20, 12, 28, 16, 32),
AnnualRatings = c(80, 120, 90, 160, 280, 350, 300, 400))
features <- mfrm_features(raters, "Rater", names(raters)[-1])
pca <- mfrm_pca(features, components = 2)
summary(pca)
#> Component Variance Proportion Cumulative Retained
#> 1 PC1 2.71834456 0.906114853 0.9061149 TRUE
#> 2 PC2 0.26968565 0.089895216 0.9960101 TRUE
#> 3 PC3 0.01196979 0.003989931 1.0000000 FALSE
pca$loadings
#> PC1 PC2
#> ExperienceYears 0.5831713 -0.5122424
#> WorkshopHours 0.5485673 0.8207647
#> AnnualRatings 0.5991537 -0.2528894
groups <- mfrm_cluster(method = "kmeans", pca, k = 2, seed = 17, silhouette = FALSE)
plot(pca, type = "scores", groups = groups)
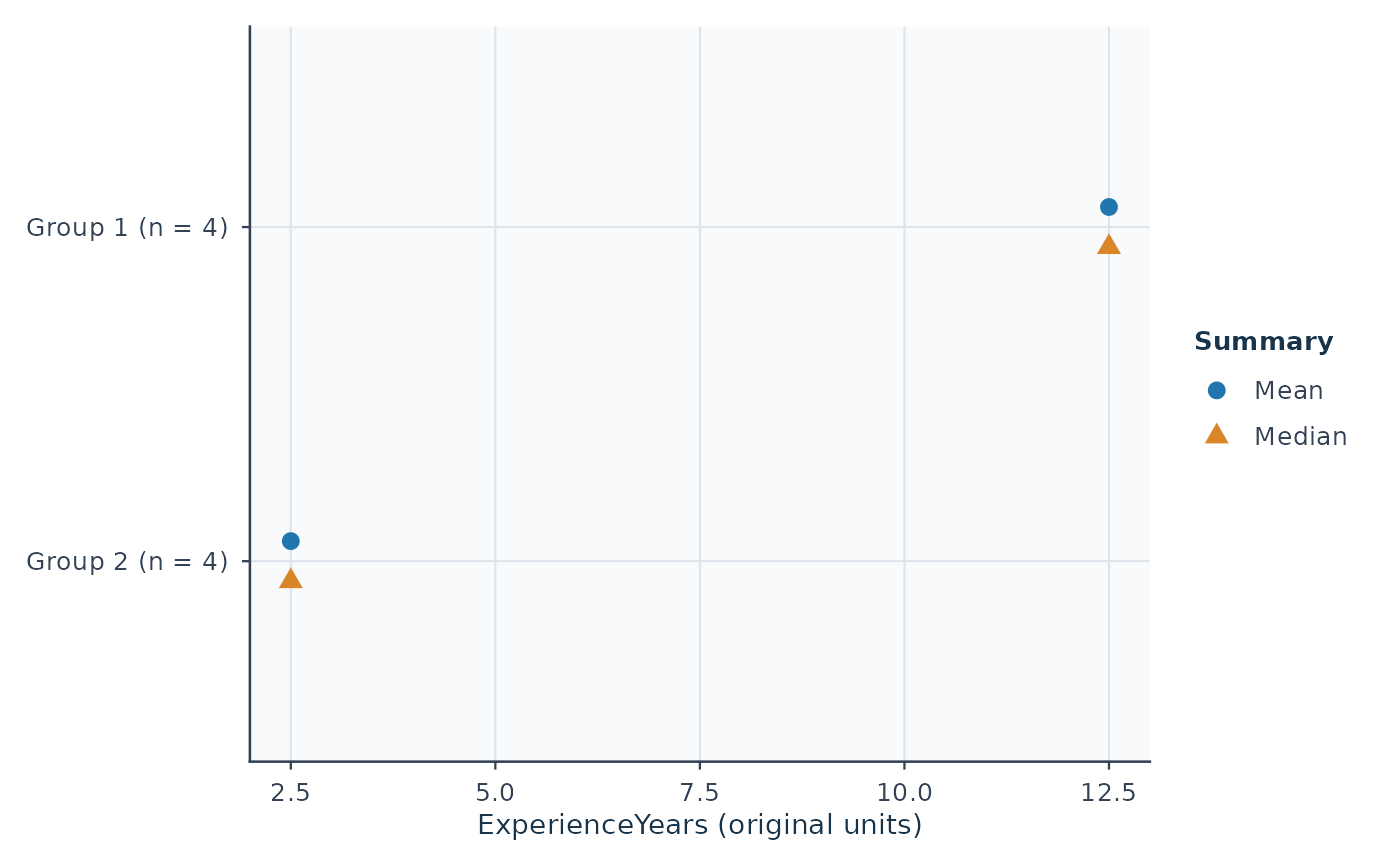
 plot(groups, type = "profile", feature = "ExperienceYears")
 # Supplementary workflow: run explicitly to keep routine checks brief.
# example("plot.mfrm_pca", run.dontrun = TRUE)
if (FALSE) { # \dontrun{
attributes <- data.frame(ID = letters[1:6],
ExperienceYears = c(1, 2, 4, 8, 10, 12),
WorkshopHours = c(8, 16, 12, 24, 16, 32))
result <- mfrm_pca(mfrm_features(attributes, "ID", names(attributes)[-1]))
plot(result)
plot(result, type = "scores")
plot(result, type = "loadings", components = 1)
plot_data(plot(result, type = "scores", draw = FALSE))$table
} # }