
Plot fitted MFRM results with ggplot2
Usage
# S3 method for class 'mfrm_fit'
plot(
  x,
  type = NULL,
  facet = NULL,
  top_n = 30,
  theta_range = c(-6, 6),
  theta_points = 241,
  title = NULL,
  palette = NULL,
  label_angle = 45,
  show_ci = NULL,
  ci_level = 0.95,
  group = NULL,
  diagnostics = NULL,
  include_fit_measures = TRUE,
  fit_stat = c("Infit", "Outfit"),
  fit_scale = c("mnsq", "zstd"),
  zstd_method = c("facets", "engine"),
  include_person = FALSE,
  person_subset = NULL,
  top_n_person = 30,
  person_labels = c("flagged", "all", "none"),
  facet_labels = c("all", "flagged", "none"),
  panel = c("combined", "facet"),
  fit_range = c(0.5, 1.5),
  zstd_cut = 2,
  draw = TRUE,
  preset = c("standard", "publication", "compact", "monochrome"),
  renderer = NULL,
  wright_style = c("native", "facets_style"),
  category_labels = NULL,
  rows_per_logit = 2L,
  wright_range = NULL,
  extreme_placement = c("ends", "estimate"),
  persons_per_star = NULL,
  show_title = FALSE,
  show_notes = FALSE,
  marginal = c("auto", "histogram", "none"),
  ...,
  level = NULL,
  view = NULL,
  metric = NULL,
  comparison = NULL,
  labels = NULL,
  highlight = NULL
)
Arguments
- x
An
mfrm_fitobject fromfit_mfrm().- type
Plot type. Omit
type(or useNULL/"wright") for the primary native Wright map. Use"bundle","all", or"default"for the three-part fit bundle; otherwise choose one of"facet","person","step","wright","pathway","fit_pathway","ccc","ccc_surface", or"category_surface"."pathway"is the theta-to-expected-score display;"fit_pathway"is the fit-statistic-to-measure display. Additional diagnostic and reporting views are listed under "Single-fit views" in mfrmr_plot_migration, with replacements for all former helpers.- facet
Optional facet name for
type = "facet".- top_n
Maximum number of non-person facet locations retained by the native Wright map for compact displays. Step transitions are always retained separately and do not consume this limit; any omitted facet locations are counted in the returned
retentiontable and disclosed in the plot subtitle/note. UseInffor a complete all-level final map. The FACETS-style payload always retains every fitted facet and step location.- theta_range
Numeric length-2 range for pathway, CCC, and category-surface plot data.
- theta_points
Number of theta grid points used for pathway, CCC, and category-surface plot data.
- title
Optional custom title.
- palette
Optional color overrides.
- label_angle
Rotation angle for x-axis labels where applicable. Native Wright maps reserve bottom space for full labels when abbreviating them would make different groups indistinguishable.
- show_ci
Whether to add approximate confidence intervals when available.
NULLselects the display-specific default:TRUEfor the primary native Wright map andtype = "fit_pathway", andFALSEfor the FACETS-style ruler and other plot types. Withrenderer = "facets", explicitly settingshow_ci = TRUEcreates a hybrid display: FACETS-style ruler grammar with mfrmr uncertainty intervals.- ci_level
Confidence level used when
show_ci = TRUE.- group
Optional grouping for
type = "wright"to overlay per-group person-density curves (DIF / DFF screening view). Either a column name (looked up first ingroup_datawhen supplied through..., then infit$prep$data) or a vector aligned withfit$facets$person. Ignored for othertypevalues and forwright_style = "facets_style", whose person column is a single FACETS-style star frequency. To pass the source data alongside, useplot(fit, type = "wright", group = "MyCol", group_data = <df>).- diagnostics
Optional matching output from
diagnose_mfrm(). Recompute it after refitting; mismatched or outdated readiness records are rejected. When supplied, Wright-map standard errors and precision metadata reuse matching rows fromdiagnostics$measureswithout replacing fitted coordinates, while pathway plot data reusefit_measures,fit_status, andcurve_fit_statusinstead of recomputing diagnostics. Must match this fitted analysis; see mfrmr_compatibility_layer for migration of saved diagnostics.- include_fit_measures
If
TRUE(default), pathway plot data include tidy fit-measure and fit-status tables for custom R graphics. Set toFALSEwhen only the curve coordinates are needed.- fit_stat
For
type = "fit_pathway", the horizontal fit statistic:"Infit"(default) or"Outfit".- fit_scale
For
type = "fit_pathway", use mean squares ("mnsq") or standardized fit ("zstd") on the horizontal axis.- zstd_method
For a ZSTD fit pathway,
"facets"(default) uses the FACETS/Wright-Masters fourth-moment df, matchingdiagnose_mfrm()."engine"retains the former package-native df convention. Neither establishes complete FACETS output equivalence. Refreshing companions from supplied diagnostics preserves their recorded WHEXACT choice.- include_person
If
TRUE, include person rows in a fit pathway.- person_subset
Optional character vector of person IDs retained in a fit pathway before ranking.
- top_n_person
Maximum person rows retained in a fit pathway, ranked by distance from expected fit. Use
Inffor all selected persons.- person_labels
Person-label policy for a fit pathway:
"flagged"(default),"all", or"none".- facet_labels
Facet-level label policy for a fit pathway:
"all"(default),"flagged", or"none". This changes drawn labels only; all retained facet rows remain in the draw-free table.- panel
Fit-pathway layout:
"combined"(distinguish persons by shape) or"facet"(one base-graphics panel per facet).- fit_range
Mean-square review lines for a fit pathway.
- zstd_cut
Absolute ZSTD review line for a fit pathway.
- draw
If
TRUE, print the resultingggplotobject.- preset
Visual preset (
"standard","publication","compact", or"monochrome").- renderer
Wright-map renderer. Use
"native"(default) or"facets"for the FACETS Table 6-style visual layout. This is the canonical selector for new code. The native map is the primary display and includes available facet uncertainty by default. The closest FACETS-style visual usesshow_ci = FALSE.- wright_style
Wright-map renderer.
"native"preserves the package's histogram, point, range, and facet-SE display."facets_style"adds a FACETS Table 6-style text ruler with person-frequency stars, signed facet headers, and labeled score-transition lines. It is a visual-layout option, not a claim of numerical equivalence with FACETS. This explicit style name is equivalent torenderer = "facets". Addingshow_ci = TRUEto that style is an mfrmr/FACETS hybrid rather than the closest FACETS-style view.- category_labels
Optional score rubric labels used by
wright_style = "facets_style". Supply a named character vector keyed by original score, an unnamed vector with one label per retained category, or a data frame withScoreandLabelcolumns.- rows_per_logit
Number of FACETS-style ruler rows per logit.
- wright_range
Optional finite increasing length-2 logit range for the FACETS-style ruler.
NULLderives a range that contains the fitted data.- extreme_placement
In the FACETS-style renderer, place extreme-score persons at the ruler
"ends"or retain their fitted"estimate".- persons_per_star
Number of persons represented by one
*in the FACETS-style frequency column.NULLchooses a compact value automatically.- show_title
Logical; display the main plot title (default
FALSE). Structural panel headings, axis labels, legends, and data labels remain visible.- show_notes
Logical; display explanatory subtitles, footnotes, and review-only title markers. Notes remain available in the returned object, and R warnings are still issued. Default
FALSE; useplot_data(p, "notes")for the descriptions and cautions outside the figure.- marginal
Marginal histogram display for two-continuous-variable scatterplots (
"auto","histogram", or"none"). Default"auto"attaches aligned X/Y marginal histograms on single-panel scatterplots with at least 8 finite plotted coordinate pairs.- ...
View-specific controls listed in mfrmr_plot_migration. The consolidated routes reject irrelevant or duplicated arguments.
- level
Named alternative to
ci_level, a single number strictly between 0 and 1. Supply only one of these names, even when equal. Both omitted retain 0.95. This controls the fitted-model plot intervals; attached interval results retain the level chosen when they were computed.- view
Optional display variant for consolidated routes: for example,
"pairs"or"heatmap"for agreement,"unified"for the former unified Wright helper, or"funnel"for shrinkage. See mfrmr_plot_migration.- metric
Quantity for a consolidated route, for example
"reliability","separation"or"strata", or"exact"/"correlation"for agreement.- comparison
Another fitted model for paired Wright/CCC displays, or an ordered list of additional fits for
type = "trajectory". Plotting does not equate their scales or perform a model-selection test.- labels
Labels for paired models or all trajectory waves, reference first.
- highlight
Optional named list of non-person facet level IDs, for example
list(Rater = c("R01", "R02")), for Wright maps only (includingview = "unified"and the Wright component of a bundle). Selected labels receive a>prefix in both renderers and saved ggplot conversion. Levels outside the usualtop_nselection are added, so the displayed count may exceed that limit. Fitted locations and uncertainty do not change; the automatic scale uses all fitted locations before compaction. Selection is not a statistical flag. Inspectlocations$Highlighted,retentionandnotesin the returned plot data. Unknown IDs or levels without finite locations are rejected.NULLselects no levels.
Value
Invisibly, a ggplot object (including a 3-panel composite
ggplot when type = "bundle" / "all" / "default"). Each returned fit
plot carries its underlying plot payload and notes accessible via
plot_data() and plot_data_components(), including domain-specific
readiness, an interpretation status, a notes table, display settings,
and a one-row scale_contract table recording the fitted coordinate basis,
population SD when applicable, discrimination basis, and GPCM MML
identification convention.
Details
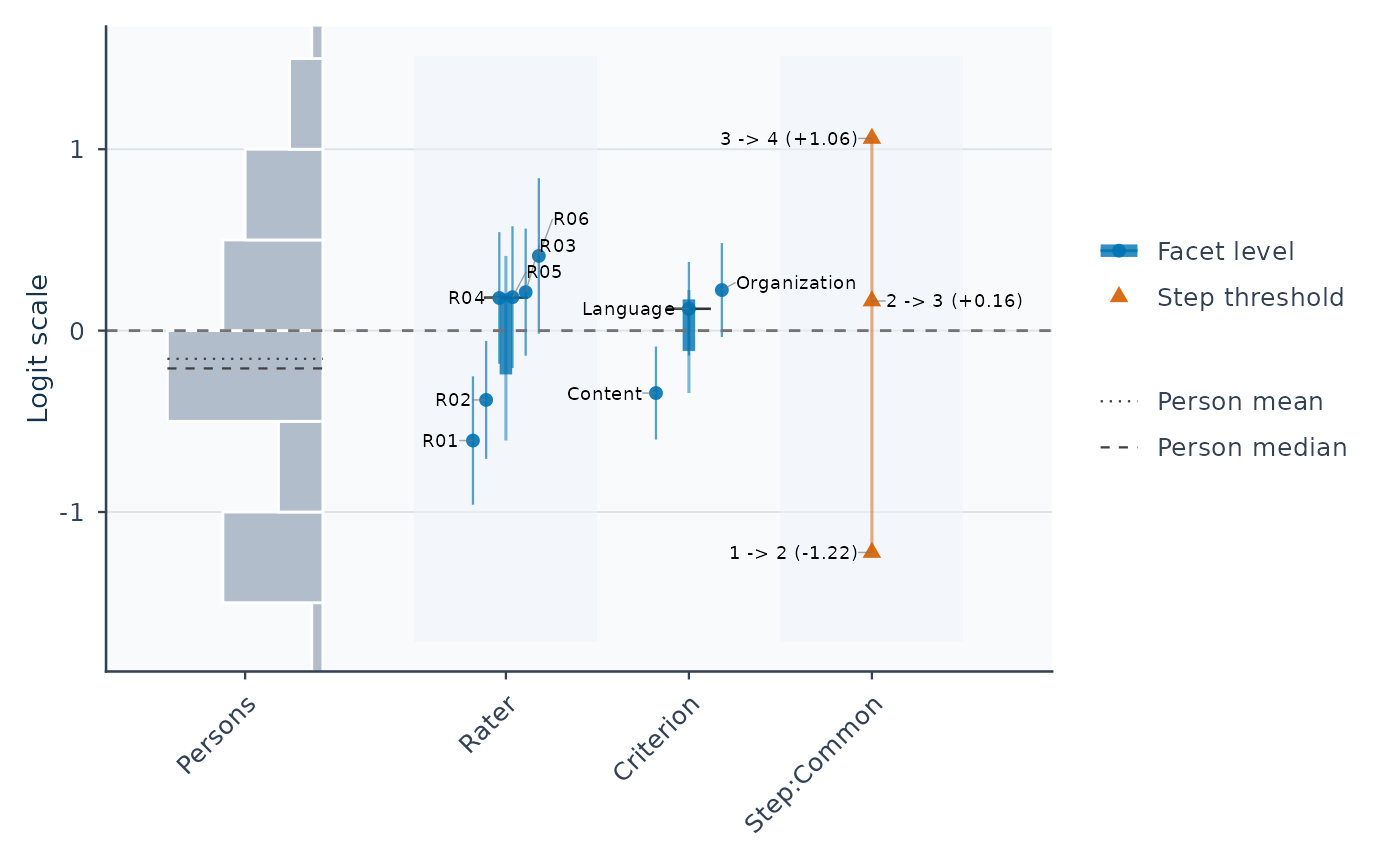
Start with plot(fit): it draws a Wright map of person abilities, rater
severities, other facet locations, and category thresholds on one logit
scale. No plot options are needed for this first view.
For adjusted-score comparisons, use plot(fit, type = "fair_average", show_ci = TRUE). metric = "FairM" uses mean reference measures;
metric = "FairZ" uses a zero reference, not a z-score. PCM averages
expectations over administered scales with the table's observation weights
and totalscore selection. Its conditional delta-method intervals use the
same retained observations as the table: finite direct anchors in ordinary
additive RSM/PCM JML are retained even with all-minimum/all-maximum responses,
including when totalscore = FALSE. The intervals use the
derivative of that same average. RSM/PCM intervals hold thresholds, other
effects and reference means fixed; they are diagnostic approximations,
not full calibration-uncertainty intervals. Inspect the returned data and
notes for the interval method and unavailable rows. See fair_average_table()
for reference definitions and plot_fair_average for view-specific controls.
For ordinary additive RSM/PCM JML, xtreme = .3, xtreme_method = "facets"
requests conditional total-score extrapolation of extreme measures and
their fair scores. Primary estimates and fixed anchors are retained.
Group-mean anchors are unsupported. The measure SE describes the corrected
total; fair-score intervals remain unavailable for positive xtreme.
The default xtreme_method = "display" retains the old average-score
display convention and leaves fair scores unchanged.
This S3 plotting method provides the core fit-family visuals for
mfrmr. When type is omitted, it returns the Wright map alone as
a ggplot object (the most useful single figure for a
first inspection). Pass type = "bundle" (or "all" / "default")
to obtain a three-panel composite ggplot containing a
Wright map, pathway map, and category characteristic curves. The
compact native default records any omitted facet locations in
plot_data(p, "retention") and the returned notes; use
top_n = Inf to retain every fitted location in the final Wright map.
LabelX / LabelY provide text positions, and leader lines connect displaced
labels to unchanged fitted points. Display labels may be shortened;
plot_data(p, "label_points") retains the full labels, fitted coordinates
and text positions for custom graphics. Step transitions share one vertical ladder and their
labels include the fitted threshold logit. When the fit records
boundary-separated facet levels and no
display range was supplied, the native and FACETS-style maps use the same
robust automatic range and place those levels at ruler ends. Exact fitted
values and intervals remain in OriginalEstimate, CI_Lower, and
CI_Upper; DisplayEstimate, DisplayCI_Lower, DisplayCI_Upper, and the
clipping-status columns describe only the rendered coordinates. Endpoint
triangles and the returned notes disclose omitted or clipped intervals.
The returned object always carries machine-readable metadata accessible
through plot_data(), even when the plot is drawn immediately.
Titles and explanatory notes are omitted from the figure by default;
use show_title = TRUE or show_notes = TRUE to include them. The returned
plot_data(p, "notes") table contains Type and Text columns for interpretation,
reference-profile conditions, and display/retention notes where applicable;
plot_data(p, "display") records the two flags.
Original titles, subtitles, coordinates, and readiness metadata are retained.
as_ggplot() respects these flags and
retains the notes in attr(plot, "mfrmr_notes").
Fit-family Wright, pathway, and CCC displays use a shared, CUD-informed
palette. The first eight series use an Okabe-Ito foundation with bright
yellow omitted and darker pink/amber/cyan entries for light backgrounds.
Beyond eight series, colours come from the dark half of the viridis HCL
palette. Expected-score and category curves also vary line type; Wright
locations retain their distinct point shapes, and small data labels use
dark neutral text. Six line types cycle for larger series sets, so dense
plots still require labels, panels, or more space. This is not a guarantee
of perceptual separation for every viewer or device.
preset = "monochrome" applies to these series. Custom palette values
are retained in the plot payload and used during saved-plot conversion;
colour overrides keep the non-colour encodings.
See https://jfly.uni-koeln.de/color/ for Color Universal Design guidance.
Every fit-derived payload also carries data$fit_readiness,
data$interpretation_status, and data$interpretation_note. Availability
and interpretability are separate: when a numerical, data, design, or
stability status requires review, the coordinates remain available for
diagnosis, but the call warns and records the review-only interpretation
in the returned metadata. Hiding an annotation changes presentation
only; it does not change the fit's interpretation status or suppress warnings.
A prior-regularized extreme MML EAP remains in fit$facets$person. If its
source fit is blocked, however, it is omitted from the Wright-map scale so
that a finite but non-interpretable trace cannot collapse the display. The
exact excluded rows and reason remain in data$person_exclusions, and the
omission is stated in data$retention_note.
type = "unexpected" uses the same default as
unexpected_response_table(): abs_z_min = 3, rule = "residual".
The optional rule = "either" or "both" also uses prob_max.
Saved table plots retain the recorded thresholds. A fully evaluated screen
with no flags yields an empty display and retains its screening summary.
type = "wright" shows persons, facet levels, and step thresholds on
a shared logit scale. Estimates are plotted as fitted, so the sign
convention follows the fit: higher Person values predict higher coded
scores in these positive-discrimination models. Whether that means more
comprehensible or less comprehensible speech depends on the rubric coding.
Under the default negative orientation, higher non-Person facet values
reduce expected coded scores; calling this greater severity/difficulty
presumes that higher scores represent better performance.
Facets listed in fit_mfrm(positive_facets = ...) are reversed
(higher values raise expected scores); state the active orientation in
figure captions when reporting.
The returned notes, accessible through plot_data(), state the recorded facet
directions and the score-coding caveat. Missing orientation in an older or
imported result is not guessed. Category labels do not recode the data.
See mfrmr_visual_diagnostics for reverse-coded comprehensibility, fit,
conditional bias and Step explanations.
Set renderer = "facets" (equivalently,
wright_style = "facets_style") for a line-printer-inspired common
ruler. That mode retains every facet location in its data and shows actual
(original, when scores were internally recoded) adjacent score transitions.
Its facets_style payload contains tidy ruler, person-frequency, facet,
step, mean-half-score, header, category-label, and settings tables for custom
graphics. RulerValue records the nearest discrete ruler row for
line-printer reconstruction, whereas step and midpoint lines are drawn at
their exact fitted DrawValue and step labels print that logit value. The
styling emulates the semantics of FACETS Table 6; estimates
and standard errors remain those produced by mfrmr. Use
show_ci = FALSE for the closest FACETS-style rendering. If
show_ci = TRUE is requested, interpret the result as a hybrid that adds
mfrmr uncertainty intervals to FACETS-style ruler grammar.
Column headings are retained even on narrow devices. If headings or person
frequency stars need more space, drawing warns; use a wider device or increase
persons_per_star for a more compact frequency column.
type = "pathway" shows expected score
traces and dominant-category regions across theta. This expected-score
display is distinct from the Bond-and-Fox-style fit-versus-measure
pathway: use type = "fit_pathway" for Infit/Outfit on the horizontal
axis and measure logits on the vertical axis. Its draw-free plot data
include person-selection settings, CI columns, and explicit SE-source
metadata. The expected-score pathway draw-free data also
includes pathway_long, pathway_annotations, fit_measures,
fit_status, and curve_fit_status, so R users can rebuild the pathway
map in ggplot2, plotly, or a report pipeline while keeping the same
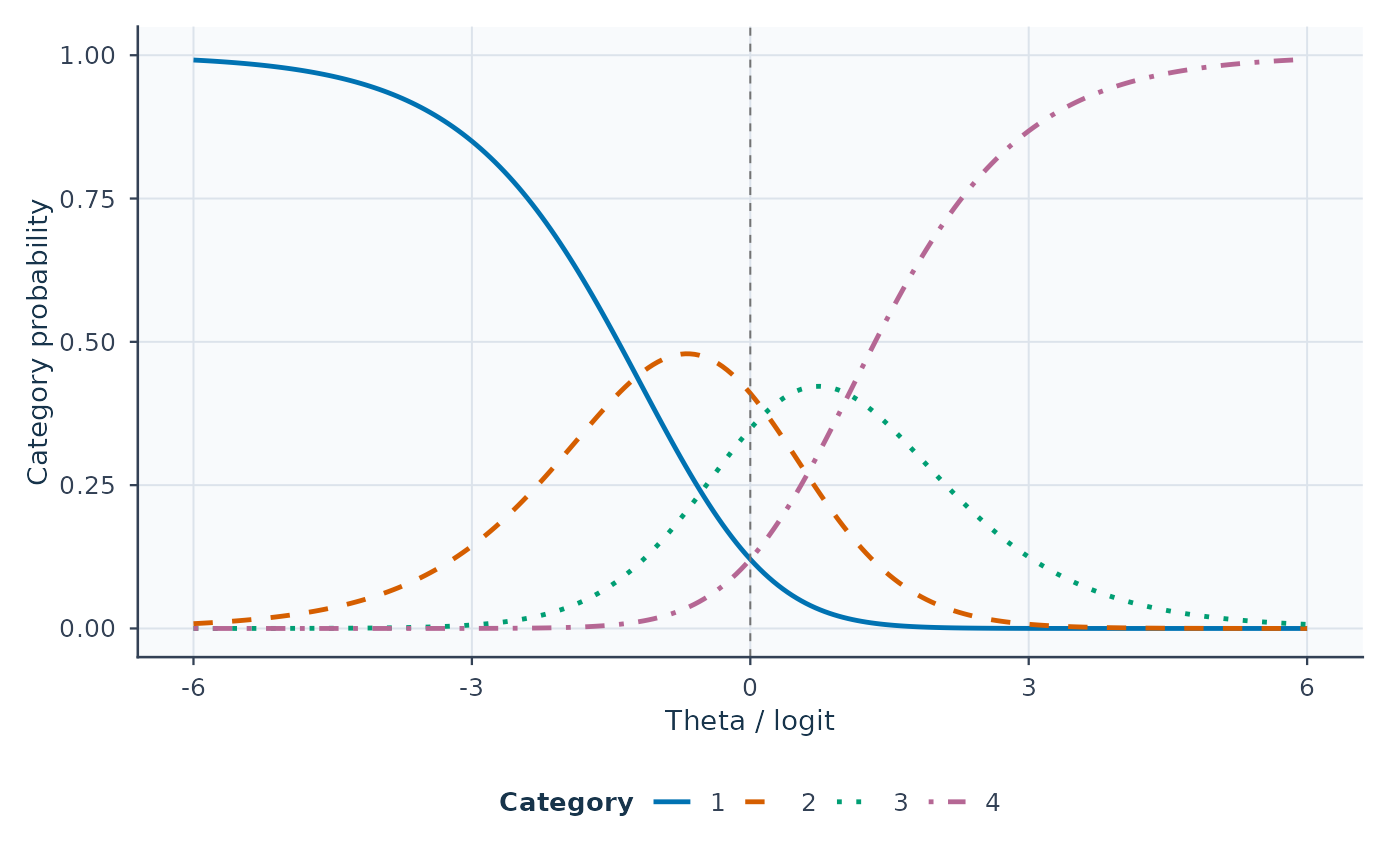
underfit/overfit labels used by fit_measures_table(). type = "ccc" shows
category response probabilities. Multiple curve groups are faceted rather
than overplotted by the native renderer, and category-specific legends use
the same colours across panels. Multiple groups or more than five categories use one legend
beside the plotting area; colour presets use distinct default colours
beyond eight categories. For GPCM, these curves retain the
estimated slope. With separate owners, each step-level/slope-level pair is
a labeled curve group. Such joint profiles have no single-facet Infit/Outfit
flag; inspect fit_measures or type = "fit_pathway" separately.
All curve families are reference-profile curves
with additive facet main effects and fitted interactions fixed at zero; the
native footer and ggplot subtitle disclose that conditioning.
Expected-score pathways use the same reference profile and expose the
same curve_basis table. These curves do not average over the observed
rater assignments or show a particular fitted interaction cell.
The draw-free curve_basis, CurveBasis, and PredictorOffset fields make
that conditioning explicit. type = "ccc_surface" or
type = "category_surface" returns 3D-ready category-probability surface
data for external rendering; it deliberately does not add a
plotly/rgl dependency or replace the 2D CCC/pathway reporting figures. The
returned object includes category_support, interpretation_guide, and
reporting_policy tables so retained zero-frequency categories and
manuscript-use boundaries remain visible to beginners. The remaining
types ("facet", "person", "step", "shrinkage") provide
compact location-specific displays.
Facet locations and practical equivalence
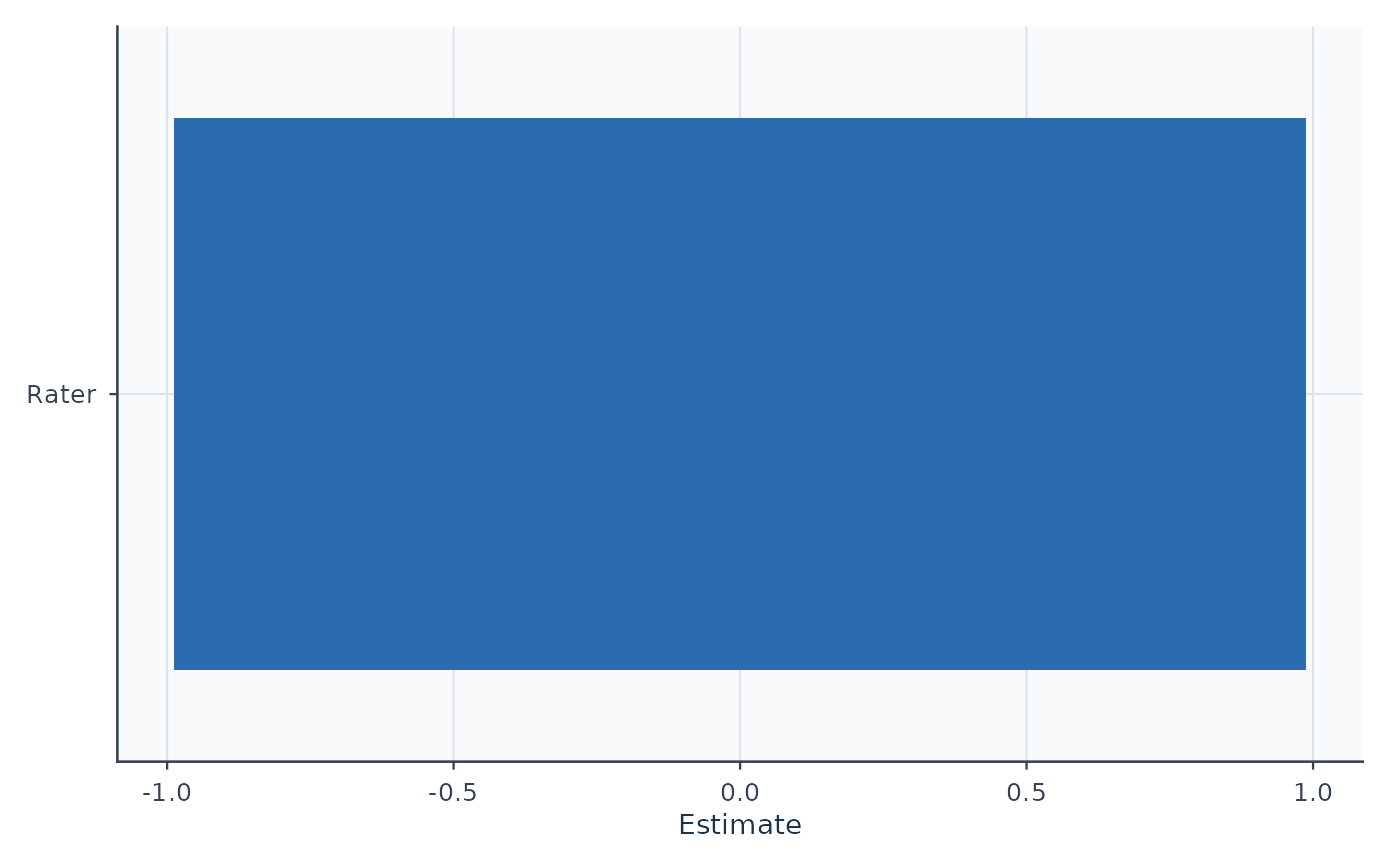
plot(fit, type = "rater_severity", facet = "Rater") orders locations
and shows available normal uncertainty intervals. Pass matching
diagnostics to reuse their precision metadata. The default has no
magnitude bands; show_bands = TRUE explicitly adds gray guides at
+/-0.5 and +/-1.0 logits. These distances from the fitted zero are not
equivalence bounds, evidence of homogeneity or calibration standards.
The returned data table uses numerical absolute-location ranges in
Band; a common range does not imply small pairwise differences.
Use p <- plot(fit, type = "rater_severity", diagnostics = diagnostics)
and plot_data() to read "data" and "notes". Intervals retain their
CIUse, SE_Method and IntervalStatus; individual whisker overlap is
not a contrast interval. analyze_facet_equivalence() separately examines
pairwise differences with their full covariance and a prespecified practical
bound in its supported MML scope. It does not use the profile's guides.
The zero depends on the model constraints/anchors, so read the signed
differences and their uncertainty instead of inferring quality from color.
Older saved profiles retain their original colors and labels when converted
with as_ggplot(); regenerate the figure from the saved fit and matching
diagnostics for the new display. No refitting is needed.
Corrected JML plots
A fit with an explicit jml_correction_order uses type = "slopes"
(default), "locations" or "steps". Locations show one facet, defaulting
to the first declared facet. style = "points" shows estimates without
intervals; "distribution" shows their empirical cumulative distribution.
These displays do not classify rater quality. They support title, caption,
show_title, show_notes, show_labels, sort, palette, preset,
text_scale, point_size, and draw-free as_ggplot() conversion. Slopes
use a reference of one; location/step displays use zero. Ordinary plot types,
show_ci = TRUE, and unrelated plot controls are rejected for this estimator.
The figure retains point estimates if their RootSE is unavailable; it cannot
be drawn if no unambiguous point solution was obtained.
Graphics layout
Single-panel plots advance through a caller's par(mfrow = ...) or
layout() arrangement and restore the style and margins they change.
Native Wright maps, multi-group CCC plots, and faceted fit pathways create
their own page layouts; call these outside a custom layout() arrangement.
Use renderer = "facets" for a single-panel Wright map in a custom grid.
A 7 by 5 inch device is a useful starting size for standalone plots;
dense PCM labels benefit from a wider device.
Native Wright/pathway plots warn when labels cannot be separated within
the available space. Enlarge the device (for example, to 12 by 8 inches)
and inspect the result; this warning concerns readability, not model fit.
Abbreviated labels retain distinguishing text where possible, falling back
to full names if needed. Original names remain available in the plot data.
For non-Latin labels, select a graphics device and font that support the
characters before plotting; the package retains the caller's font family.
Typical workflow
Fit a model with
fit_mfrm().Use
plot(fit)to inspect the Wright map at a glance.Switch to
type = "pathway","fit_pathway","ccc", or"shrinkage"for the relevant follow-up figure, ortype = "bundle"for the three-plot overview when preparing a FACETS-style summary.
Further guidance
For a plot-selection guide and extended examples, see
mfrmr_visual_diagnostics and
vignette("mfrmr-visual-diagnostics", package = "mfrmr").
Session plot defaults
See mfrmr_visual_diagnostics for options(mfrmr.plot_preset), argument
precedence, and appearance when saving or reusing a plot.
See also
fit_mfrm(), plot(x, type = "wright", view = "unified"), plot(x, type = "bubble"),
mfrmr_visual_diagnostics
Examples
library(mfrmr)
# Saved synthetic MML/RSM analysis of example_operational.
# For your own data, fit a model first; see ?fit_mfrm.
example_fit <- readRDS(system.file("examples", "operational-mml.rds", package = "mfrmr"))
fit <- example_fit$fit
# Run each plot command separately to inspect its figure
plot(fit) # Wright map: persons, facets, and category thresholds
 # Rater severity estimates (higher means more severe in this example)
plot(fit, type = "facet", facet = "Rater")
 # Probability of each score category across the ability scale
plot(fit, type = "ccc")
 # Optional: get plot without printing and inspect underlying tables
wright <- plot(fit, draw = FALSE)
head(plot_data(wright, "locations"))
#> # A tibble: 6 × 39
#> Group Label PlotType Estimate SE Fixed CI_Level SE_Method PrecisionTier
#> <fct> <chr> <chr> <dbl> <dbl> <lgl> <dbl> <chr> <chr>
#> 1 Rater R01 Facet level -0.606 0.181 FALSE 0.95 Observati… exploratory
#> 2 Rater R02 Facet level -0.382 0.166 FALSE 0.95 Observati… exploratory
#> 3 Rater R04 Facet level 0.180 0.185 FALSE 0.95 Observati… exploratory
#> 4 Rater R05 Facet level 0.184 0.199 FALSE 0.95 Observati… exploratory
#> 5 Rater R03 Facet level 0.212 0.179 FALSE 0.95 Observati… exploratory
#> 6 Rater R06 Facet level 0.412 0.219 FALSE 0.95 Observati… exploratory
#> # ℹ 30 more variables: SupportsFormalInference <lgl>, SEUse <chr>,
#> # CIBasis <chr>, CIUse <chr>, CIEligible <lgl>, CILabel <chr>,
#> # Measure_Source <chr>, CI_Lower <dbl>, CI_Upper <dbl>, Step <chr>,
#> # StepIndex <int>, BoundarySeparated <lgl>, Highlighted <lgl>, XBase <dbl>,
#> # X <dbl>, OriginalEstimate <dbl>, BelowRange <lgl>, AboveRange <lgl>,
#> # DisplayEstimate <dbl>, DisplayLabel <chr>, OriginalCI_Lower <dbl>,
#> # OriginalCI_Upper <dbl>, DisplayCI_Lower <dbl>, DisplayCI_Upper <dbl>, …
# Find a named judge without refitting or dropping the surrounding scale
judge <- subset(plot_data(wright, "locations"), Group == "Rater")$Label[1]
focused <- plot(fit, highlight = list(Rater = judge), draw = FALSE)
subset(plot_data(focused, "locations"), Highlighted)
#> # A tibble: 1 × 39
#> Group Label PlotType Estimate SE Fixed CI_Level SE_Method PrecisionTier
#> <fct> <chr> <chr> <dbl> <dbl> <lgl> <dbl> <chr> <chr>
#> 1 Rater R01 Facet level -0.606 0.181 FALSE 0.95 Observati… exploratory
#> # ℹ 30 more variables: SupportsFormalInference <lgl>, SEUse <chr>,
#> # CIBasis <chr>, CIUse <chr>, CIEligible <lgl>, CILabel <chr>,
#> # Measure_Source <chr>, CI_Lower <dbl>, CI_Upper <dbl>, Step <chr>,
#> # StepIndex <int>, BoundarySeparated <lgl>, Highlighted <lgl>, XBase <dbl>,
#> # X <dbl>, OriginalEstimate <dbl>, BelowRange <lgl>, AboveRange <lgl>,
#> # DisplayEstimate <dbl>, DisplayLabel <chr>, OriginalCI_Lower <dbl>,
#> # OriginalCI_Upper <dbl>, DisplayCI_Lower <dbl>, DisplayCI_Upper <dbl>, …