
MFRM Desktop User Guide — Windows & macOS
日本語ガイド · Project Overview · Why MFRM? · Get & Open · Sample Walkthrough · Prepare Your CSV · Choose an Analysis · Interpret Every Plot · Save & Reopen · Troubleshooting
Why Use MFRM? Start with a Concrete Example
Suppose you are analyzing university essay ratings (or L2 speaking interviews, music juries, or clinical OSCE stations) for a thesis or departmental assessment. Four trained raters (R1–R4) score 30 students across two writing prompts (Task1, Task2) and four rubric criteria (Content, Organization, Language, Mechanics) on a 0–5 scale.
In realistic testing programs, you rarely want to rely on raw score averages alone:
- The "severe rater / hard prompt" trap: Suppose Student A writes
Task2(an abstract policy argument) and is graded byR4(the most severe rater), earning a raw average of 3.2 / 5.0. Student B writesTask1(a familiar personal topic) forR1(the most lenient rater) and averages 3.6 / 5.0. Raw averages make Student B look stronger—even if Student A actually demonstrated higher ability under tougher conditions. - Why correlation or Kappa isn't enough: Even if
R1andR4correlate atr = 0.90,R4might consistently award scores one point lower thanR1. High rank-order agreement does not remove a constant severity gap. - Why rubric steps need checking: Writing
"0 = Emerging … 5 = Exemplary"on a rubric sheet does not guarantee raters actually use all six categories cleanly or treat Content and Mechanics with equal severity.
What MFRM & G/D Studies Give You Instead
- One shared "logit" ruler (
MFRM): MFRM converts ordinal rubric scores into a common log-odds (logit) scale centered at0.00for non-person facets:- Examinees (
Person): Higher logits = higher ability (adjusted for the raters, tasks, and criteria involved). - Raters (
Rater): Higher logits = greater severity; lower (negative) logits = greater leniency. - Tasks & Criteria (
Task,Criterion): Higher logits = harder to earn high scores on; lower logits = easier.
- Examinees (
- Quality diagnostics (
Fit,Category Curves,Bias): Checks whether a severe rater is predictably severe (Infit MnSq ≈ 1.00) vs. erratic (Infit >> 1.00), whether every rubric score (0–5) has its own clear zone, and whether specific pairs (likeR1 × Content) behave unusually. - Practical assessment design (
G/D Study): Uses observed scores to show how reliability (Gfor relative ranking,Phifor pass/fail cutoffs) changes if you assign 2 vs. 3 raters or 2 vs. 4 tasks.
All of these run offline in one three-step desktop window (Data → Settings → Results), with an instant English / 日本語 switch in the top bar.
1. Get and Open the App
Why macOS & Windows show an "unverified" notice — and how to open in 3 steps
MFRM Desktop is distributed 100% free of charge as open-source academic software without paid commercial Apple Developer Program notarization or commercial Windows code-signing subscriptions. Because no commercial signing certificate is attached, macOS Gatekeeper ("MFRM-Desktop" Not Opened — Apple could not verify "MFRM-Desktop" is free of malware) and Microsoft Defender SmartScreen (Windows protected your PC) display a standard first-launch confirmation—not because malicious code was detected, but because the archive is unnotarized / unsigned.
Three transparent safeguards protect your work:
- 100% open source: Every line of estimation and GUI code is publicly auditable in the GitHub repository.
- 100% offline analysis (zero data upload or telemetry): All CSV reading, estimation, plotting, and
.mfrm/.html/.csvsaving run locally on your machine—you can turn off Wi-Fi before launching and run every analysis workflow offline (only clicking Help → Web theory and help opens online documentation in your browser, without uploading desktop data). - Official GitHub Releases & build provenance: Both ZIP archives are hosted directly on GitHub Releases (TOK0) with verified SHA-256 digests and GitHub Actions Sigstore provenance on Windows.
macOS (Apple Silicon, M1 or Later) — Standalone Preview ZIP
MFRM Desktop uses the Data → Settings → Results interface on Apple Silicon Macs (arm64, bundled libraries targeting macOS 14.0+; Python is bundled inside MFRM-Desktop.app, while Intel Macs can run from Python source):
- Download TOK0 (release notes).
- Double-click the ZIP in Finder to expand
MFRM-Desktop.app, and move it to a writable folder such asApplications. - Double-click
MFRM-Desktop.appand complete the one-time Apple TOK1 approval (macOS Sequoia 15+ / Sonoma 14+):- When "MFRM-Desktop" Not Opened appears, click
Done— do NOT click the blueMove to Trashbutton. - Open System Settings → Privacy & Security and scroll down to the Security section.
- Next to "MFRM-Desktop" was blocked to protect your Mac, click
Open Anywayand authenticate with Touch ID or your Mac password (needed once only; opens normally every time after that).
- When "MFRM-Desktop" Not Opened appears, click
Keep macOS protections enabled: Only use Open Anyway if your institution's Mac policy permits it. Never disable Gatekeeper globally, never strip quarantine attributes in Terminal, and investigate rather than override any damaged-app warning.
Windows 11 (x64) — Standalone Preview ZIP
Python is bundled inside the download—no Python, R, FACETS, or ConQuest installation is needed.
- Download TOK0 (release notes & sample projects).
- In File Explorer, right-click
MFRM-Desktop-Windows-x64.zipand select Extract All. KeepMFRM-Desktop.exeand the entire_internalfolder together in the same folder (never run the EXE from inside the unextracted ZIP or move the EXE alone). - Double-click
MFRM-Desktop.exe. If Microsoft Defender SmartScreen (Windows protected your PC) appears, clickMore info→Run anyway(needed once only; if institutional policy blocks execution, record the exact message for support).
Keep Windows protections enabled: Never turn off Microsoft Defender or Windows security settings to open the preview. Windows on ARM and other Windows editions are not verified, and this preview (0.2.19-beta) is not certified across every Windows configuration.
Optional: Verify SHA-256 checksum or GitHub build provenance before first launch
GitHub automatically displays the verified `sha256` digest next to each file on [`desktop-20261031`](https://github.com/Ryuya-dot-com/MFRM_Python_Application/releases/tag/desktop-20261031) alongside `SHA256SUMS.txt`. To verify locally: - **macOS Terminal:** `shasum -a 256 "$HOME/Downloads/MFRM-Desktop-macOS-arm64.zip"` - **Windows PowerShell:** `Get-FileHash "$HOME\Downloads\MFRM-Desktop-Windows-x64.zip" -Algorithm SHA256` - **Windows SLSA Provenance (GitHub CLI):** `gh attestation verify "$HOME/Downloads/MFRM-Desktop-Windows-x64.zip" --repo Ryuya-dot-com/MFRM_Python_Application`Want to try in a browser first?
Open the Web App with synthetic or properly de-identified data.
2. Try the Sample — Walkthrough with Actual Numbers
Let's run the built-in synthetic essay dataset (30 examinees × 4 raters × 2 tasks × 4 criteria = 960 ratings) and read the exact numbers that appear on screen:
- In Data, click Sample (
Writing sample (synthetic data)), inspect the 10-row preview, and click Next. - In Settings → Columns / rubric, confirm the pre-filled values (
Person=Person,Score=Score, Facets =Rater,Task,Criterion, Minimum / Maximum =0/5). Leave Model / estimation on the defaults (RSMandJMLE). - Click Analyze (and confirm the 960-row prompt). Within seconds, Results opens.
Check what you just discovered in Table → Measures and Fit
Switch to Table and look at the non-person rows of Measures and Fit:
| Facet | Level | Estimate (logits) | Infit MnSq | Plain-language takeaway from this sample |
|---|---|---|---|---|
Rater | R1 | -0.726 | 1.006 | Most lenient rater (0.73 logits below the rater mean), and very consistent (Infit ≈ 1.01). |
Rater | R2 | -0.093 | 0.980 | Close to average severity, consistent fit. |
Rater | R3 | +0.352 | 0.950 | Moderately severe, consistent fit. |
Rater | R4 | +0.467 | 1.052 | Most severe rater—1.19 logits more severe than R1, yet still consistent (Infit ≈ 1.05)! |
Task | Task1 / Task2 | -0.311 / +0.311 | 1.043 / 0.951 | Task2 is 0.62 logits harder than Task1. |
Criterion | Content → Mechanics | -0.556 → +0.283 | 1.065 → 0.943 | Raters award high marks most readily on Content (-0.56) and score Mechanics (+0.28) and Language (+0.23) more severely. |
(Note: In JMLE, the table's Conditional SE / SD and bounds hold other fitted parameters fixed as screening approximations—always read the note directly below each table!)
Now switch to Observed Category Use: all six rubric categories (0 through 5) are well populated—from 72 ratings (7.5%) at score 0 and 96 (10.0%) at score 5 up to 230 (24.0%) at score 2 and 225 (23.4%) at score 3. Finally, try Save project (.mfrm) and Save report (.html).
3. Prepare and Import Your Own CSV
Reshape wide spreadsheets into "one row = one rating"
Spreadsheets exported from gradebooks often put raters side by side (wide format). Before importing into MFRM Desktop, stack them so every row is one single rating event:
❌ Wide format (do NOT import directly):
Student, Task, Criterion, Rater1_Score, Rater2_Score
E01,     T1,   Content,   4,            5

✅ Long format (ready for MFRM Desktop):
Person,Rater,Task,Criterion,Score
E01,R1,T1,Content,4
E01,R2,T1,Content,5
(Click CSV format → Save example CSV in the app or inspect TOK0 for a complete template.)
Four data-checks before clicking Analyze
- Save as UTF-8 CSV: In Excel, pick CSV UTF-8 (Comma delimited) (
*.csv). Japanese and accented column/level names are supported; leading zeros in IDs (like007) are kept intact. - Use individual integer ratings, not averages: MFRM models discrete rubric categories (
0, 1, 2, 3, 4, 5). Fractional scores (like3.5) will stop validation with an explanation. Every row receives equal (unit) weight. - Enter the full rubric range—and never code "missing" as
0: On a 0–5 rubric, type0and5in Settings even if nobody scored0. If a rater skipped an essay, omit that row or leaveScoreblank (0means an earned score of zero!). - Make sure raters and tasks overlap ("connectedness"): If Raters A & B only grade Group 1 and Raters C & D only grade Group 2 with zero shared students or tasks, no statistical model can tell whether Group 1 is stronger or Raters A & B are simply more lenient! Design rating assignments with shared examinees/tasks across raters.
4. Choose the Right Analysis for Your Research Question
In Settings, select MFRM (tabs: Columns / rubric, Model / estimation, Bias / intervals, G/D plan) or standalone G/D Study:
| Your research or practical question | What to select in Settings | How it works & what conditions apply |
|---|---|---|
| Do all tasks and criteria share the same 0–5 rubric structure? | MFRM → Model: RSM (Rating Scale Model) | Estimates one shared set of step thresholds across the whole rubric. Great starting point when every criterion uses the same 0–5 descriptors. |
| Do different criteria or tasks have different step spacing (or different score ranges)? | MFRM → Model: PCM (Partial Credit Model) + choose PCM step facet | Lets each level of the chosen facet (e.g., Criterion) have its own step thresholds—useful when jumping from 4 → 5 is much steeper in Mechanics than in Content. |
Should I pick JMLE or MML? | MFRM → Estimation method: JMLE or MML | JMLE jointly estimates individual person and facet parameters (with screening safeguards when a free level has only min or max scores). MML treats persons as drawn from a normal distribution with a user-set MML fixed population SD (estimated via EM) and is required if you want Specified intervals or Joint interaction. |
| Does a specific rater grade a specific task/criterion unusually harshly or leniently? | MFRM → Bias / intervals → Bias (registered requests) → pick Facet A, Facet B → click Add | Computes descriptive cell shifts holding the main calibration fixed. Ideal for spotting rater-training topics; does not prove statistical significance or fairness. |
What is the confidence interval for Rater 4's severity, or for R4 − R1? | MFRM (MML) → Bias / intervals → Specified intervals → pick facet / A − B → click Add | Computes pointwise asymptotic normal intervals using full structural covariance only for targets that pass stopping, identification, boundary, information, and quadrature checks. |
What happens if we refit the model with Facet A × Facet B estimated jointly alongside main effects? | MFRM (MML, fixed SD = 1) → Bias / intervals → Joint interaction → check Add to next analysis | Fits a separate fixed-N(0,1) RSM/PCM interaction model. Reports pointwise approximate Wald intervals & p-values for eligible cells/contrasts, plus Holm-adjusted p-values across the recorded family of requested tests (intervals remain pointwise, not simultaneous). |
| Would 3 raters × 2 tasks or 2 raters × 3 tasks give higher score reliability? | Top selector: G/D Study (or check Add G/D to MFRM in G/D plan) | Runs balanced crossed ANOVA on original observed scores (no MFRM fit needed in standalone mode). Requires completely crossed, balanced data with 1 or 2 random facets, >= 2 levels per factor, 1 observation per cell, and unit weights. |
Remember to click Add! In Bias (registered requests) and Specified intervals, picking facet names in the dropdowns does not register them until you click Add and see the request listed in the box.
5. Interpret Every Plot — What Patterns Mean in Practice
Here is how to read each visual output in Results, including both healthy patterns and warning signs you might encounter in your own thesis or assessment data:
5.1 Wright Map — Scale Targeting & Facet Spread
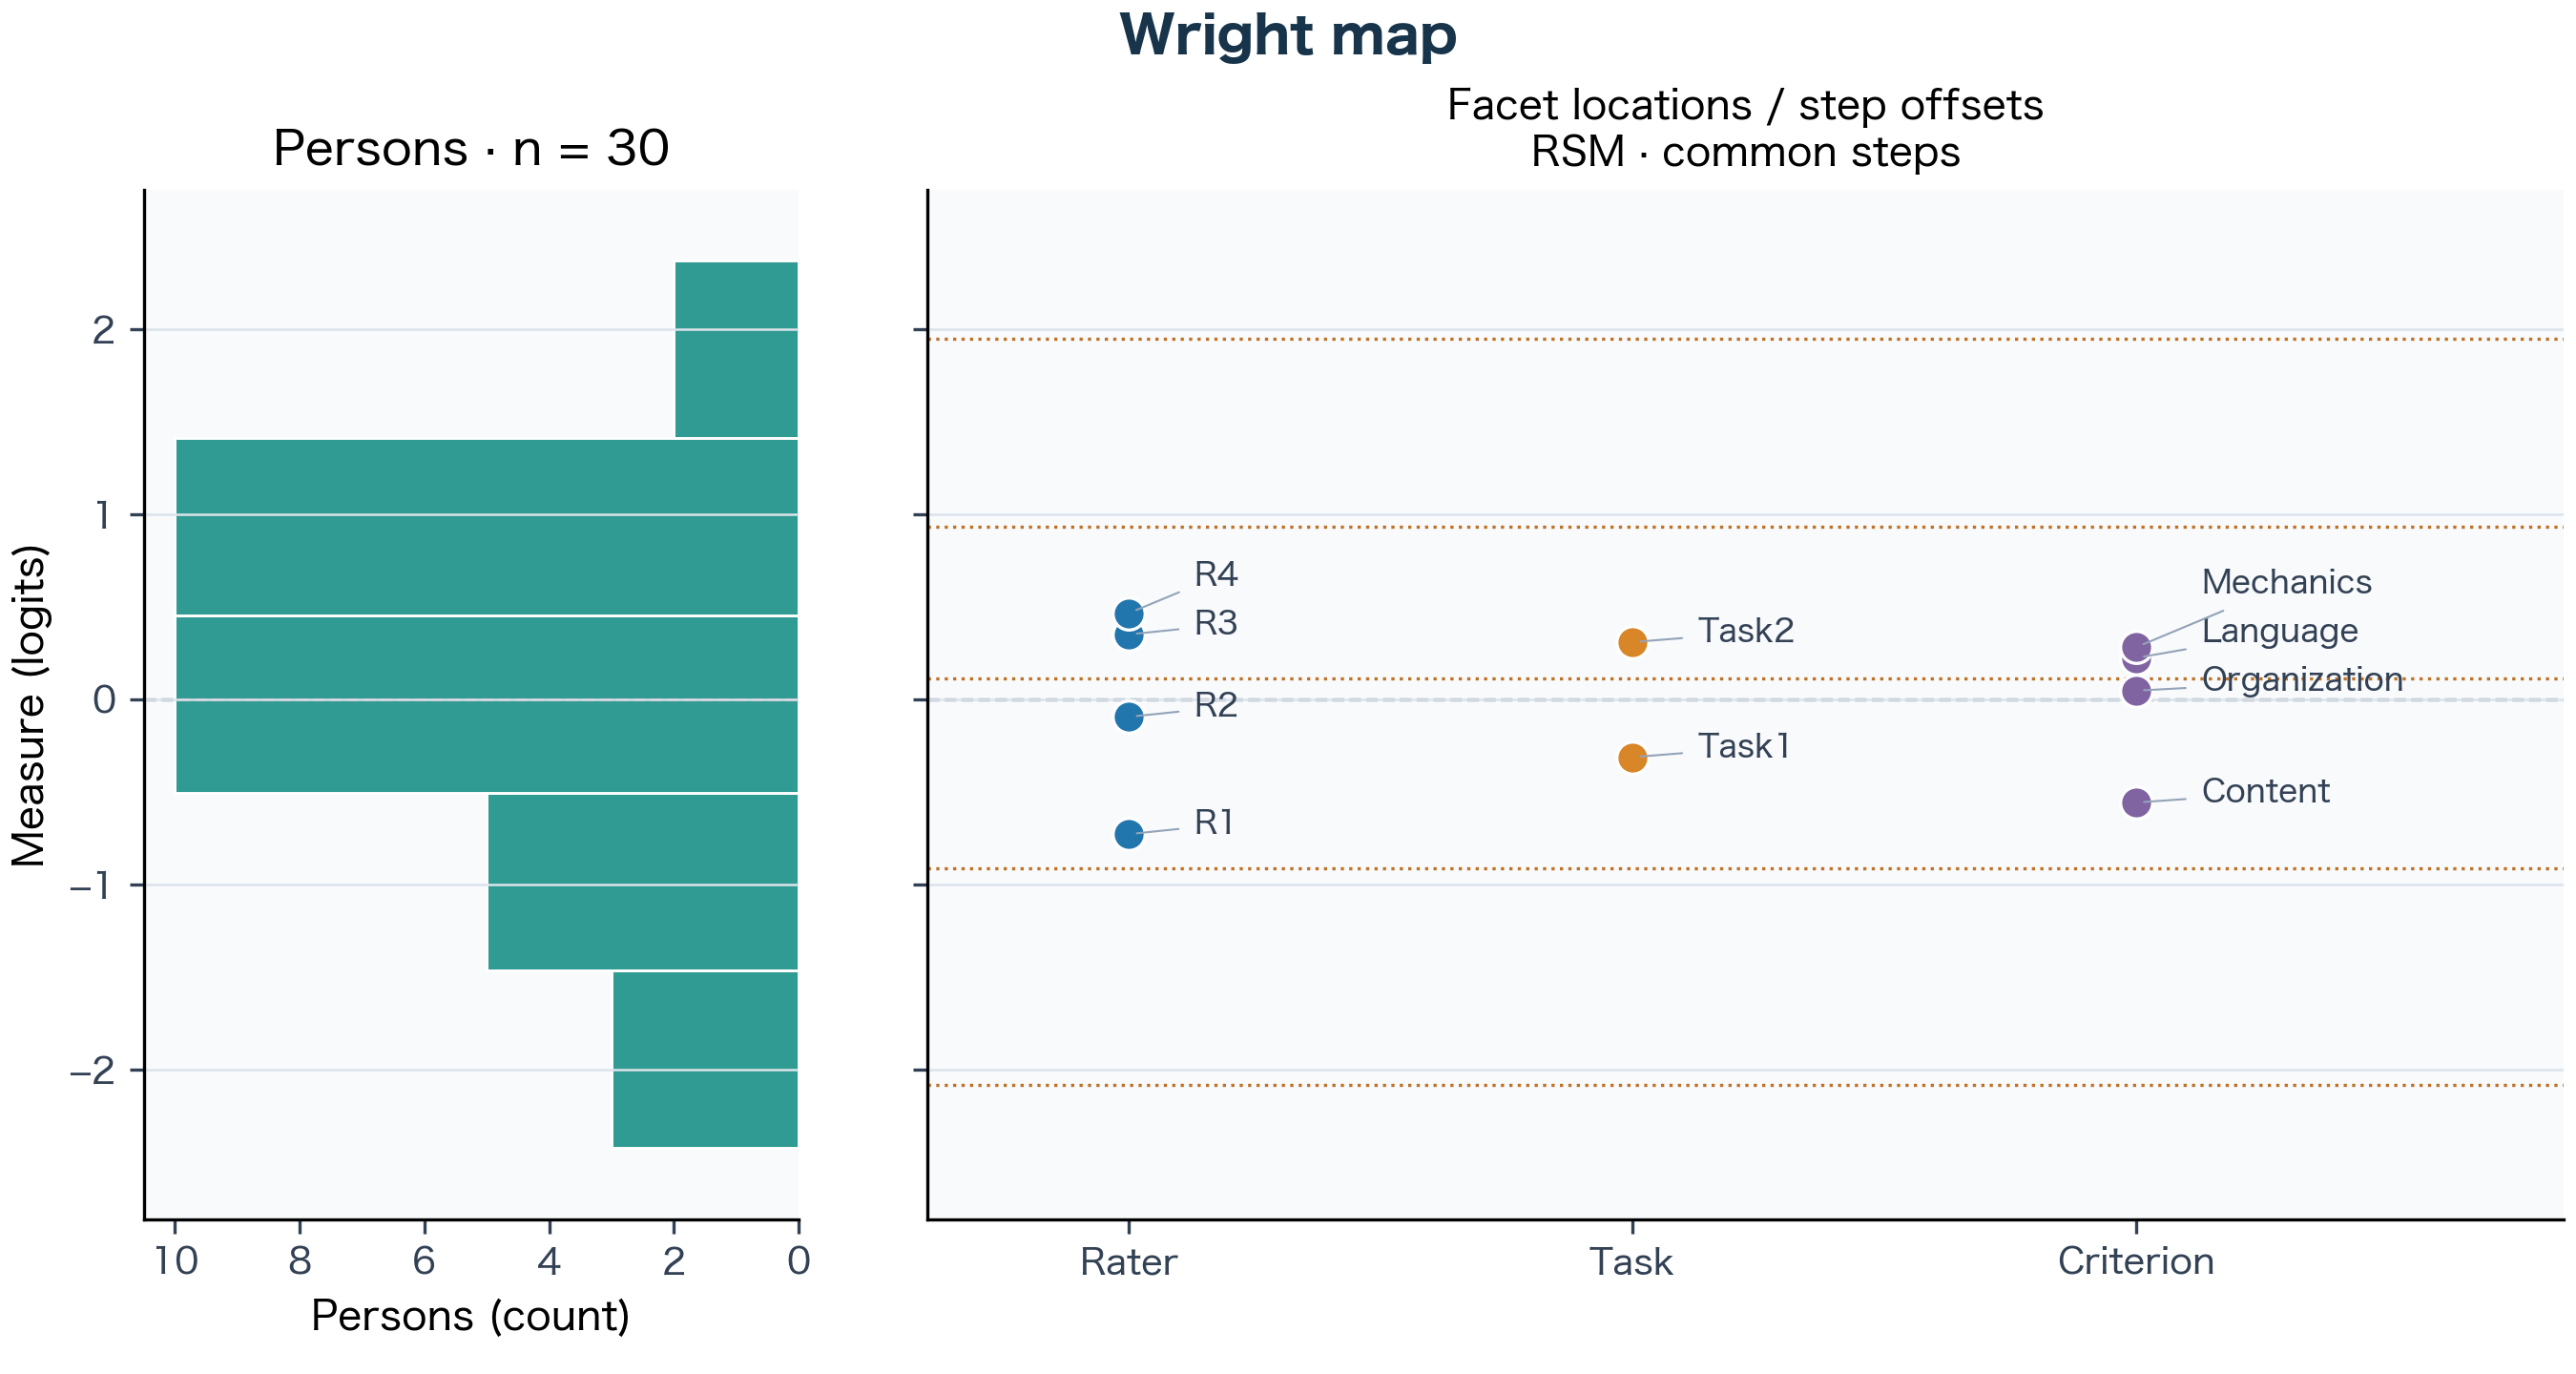
| What you observe on the Wright map | How to interpret it | Practical next step |
|---|---|---|
| Person bars (left) overlap well vertically with facet points & dotted step lines (right) | Tasks and rubric categories are well matched ("targeted") to your examinees' ability range. | Proceed to inspect individual facet spreads and fit in Pathway map and Table. |
Persons cluster near +3 logits while tasks/steps sit near 0 (or vice versa) | Ceiling or floor effect: Tasks/rubric were too easy or too hard for this cohort, making extreme examinees harder to separate precisely. | Check Observed Category Use for bunching at the top/bottom score and check extreme-score notes in Measures and Fit. |
Wide vertical gap among raters (e.g., R4 = +0.47 vs. R1 = -0.73) | Raters differ substantially in overall severity—raw unadjusted averages would disadvantage students rated only by R4. | Check Pathway map next: if R4 sits near Infit = 1.0, MFRM's main-effect adjustment accounts for R4's consistent severity. |
5.2 Pathway Map — Separating Severity from Consistency (Infit MnSq)
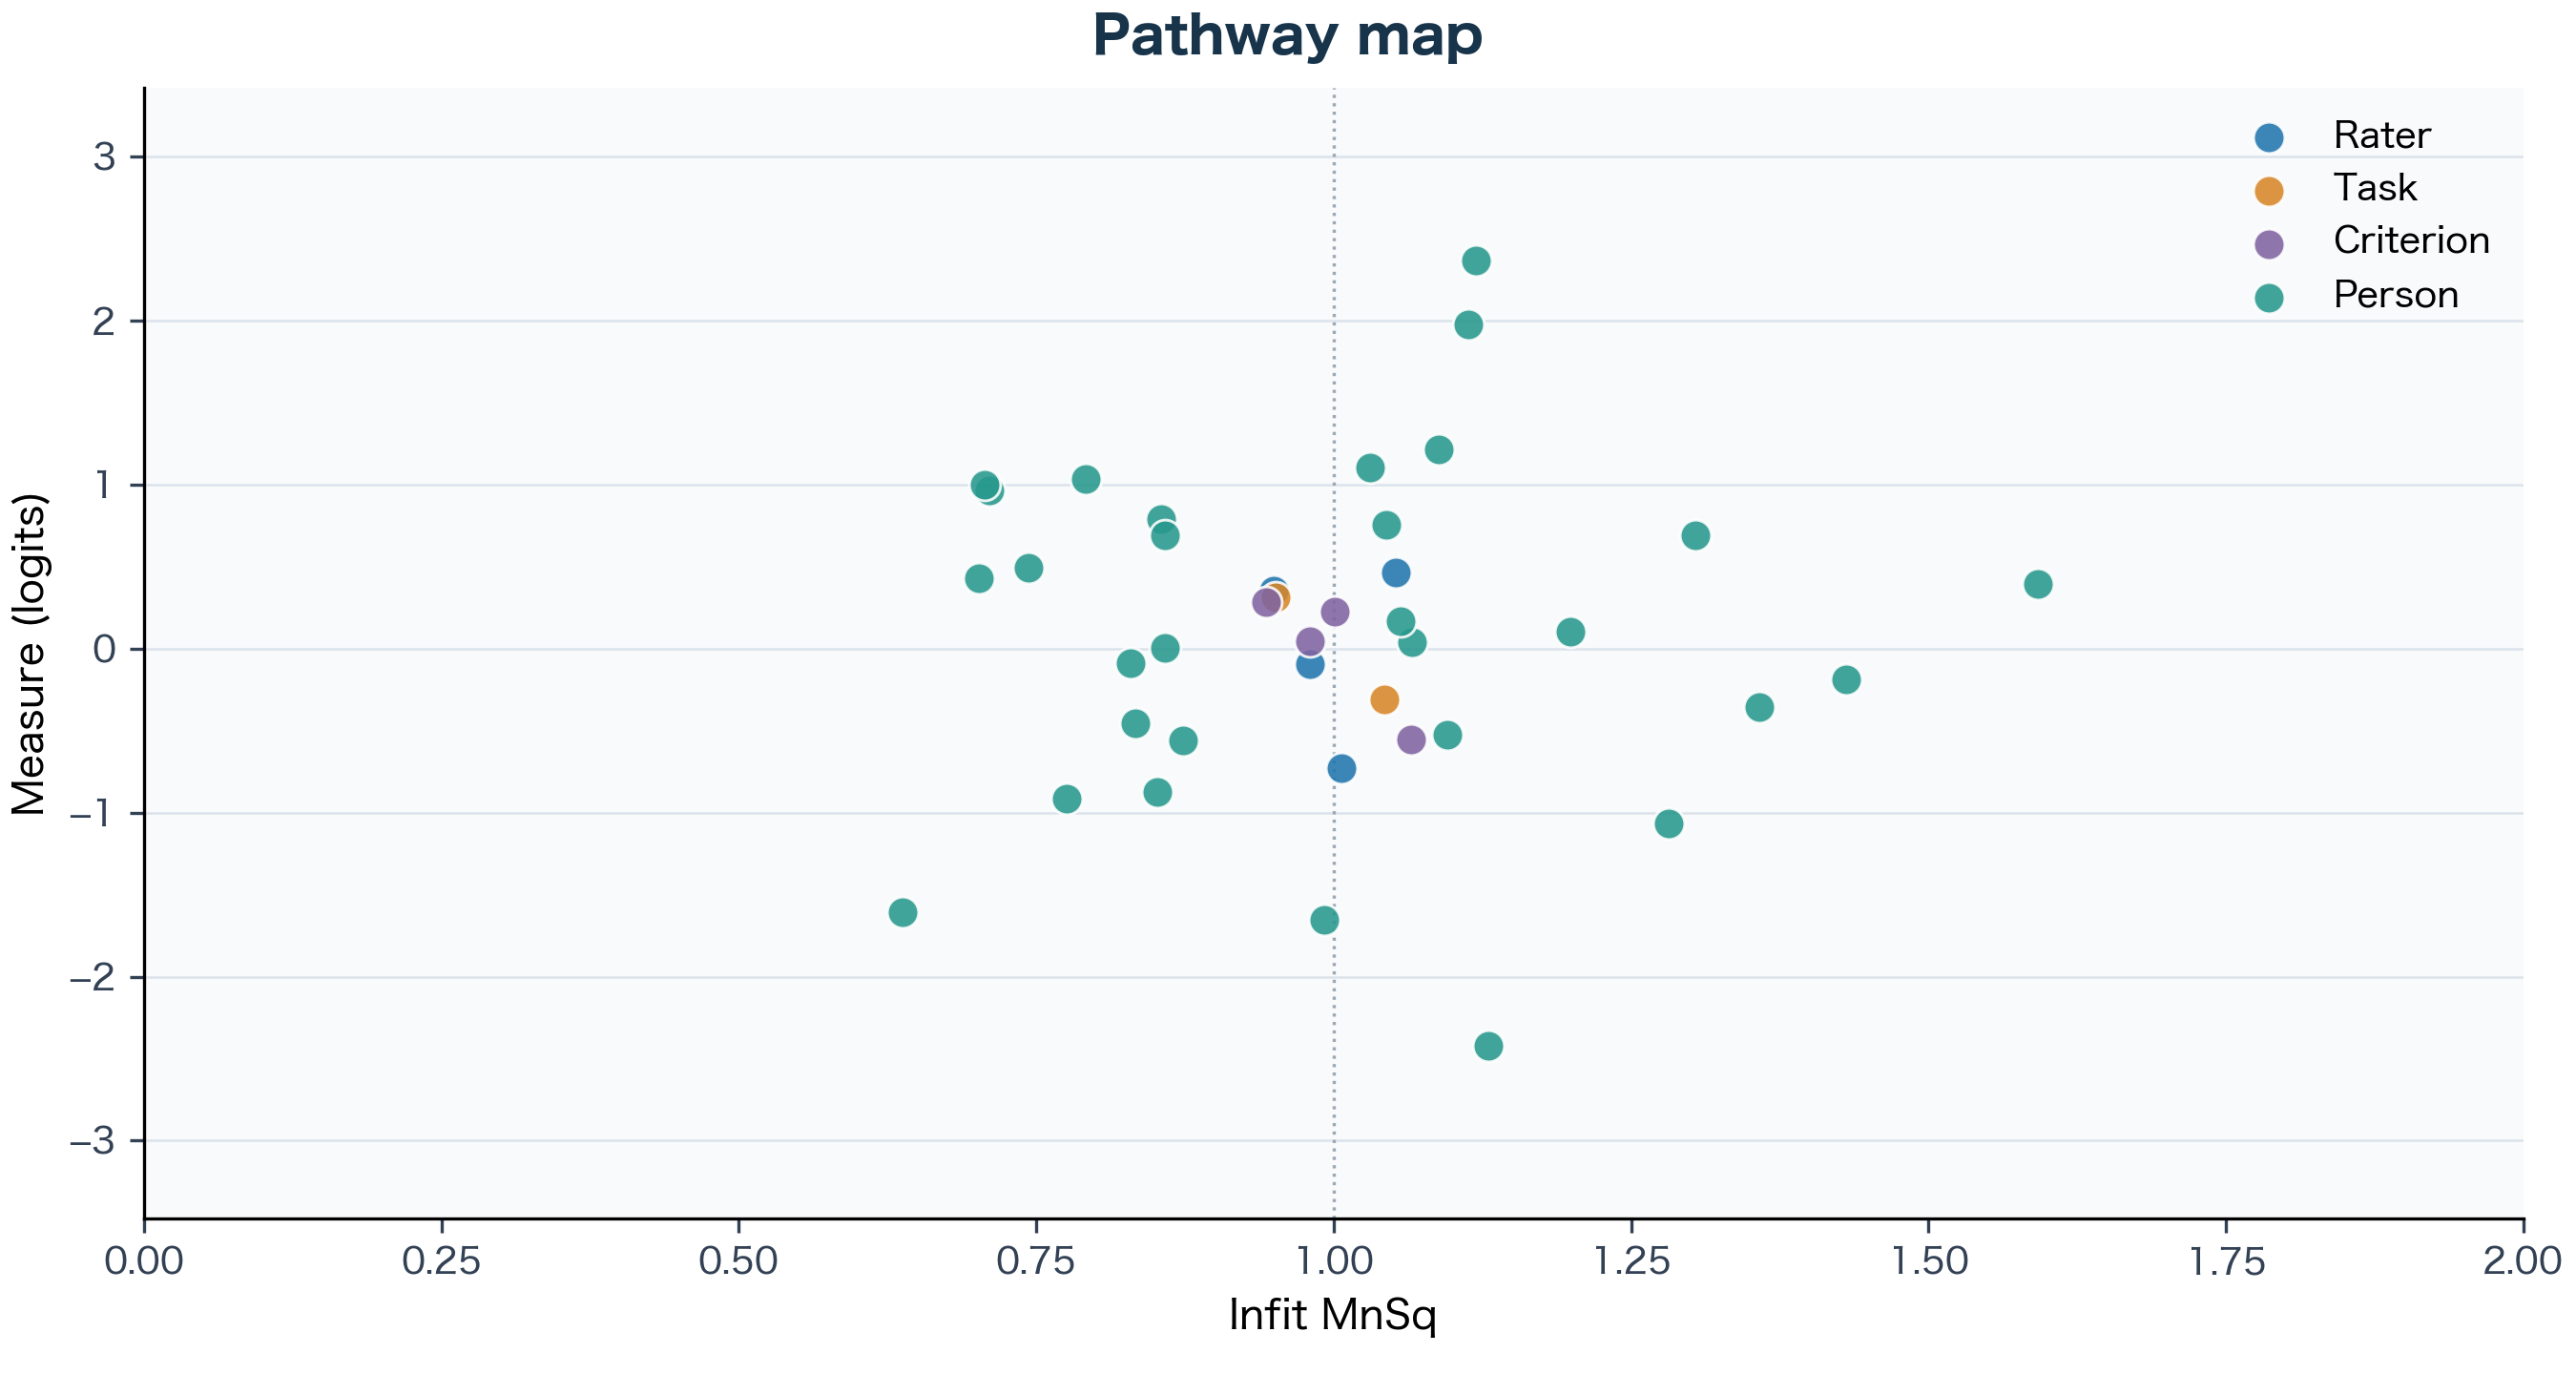
One of the most useful ideas in Rasch measurement for graduate research is that vertical position (severity/difficulty) and horizontal position (Infit MnSq consistency) ask two completely different questions:
Horizontal region (Infit MnSq) | Meaning in everyday assessment terms | How to handle it in your study |
|---|---|---|
Near 1.00 (dotted reference line) | Model-consistent variation: A severe rater near 1.00 grades toughly in a predictable way; a lenient rater near 1.00 grades generously in a predictable way. | Main-effect logit estimates meaningfully summarize their overall severity or difficulty. |
**Far to the right (> 1.0, underfit / noisy, e.g., 1.4–2.0+)** | Unexpected/erratic ratings: For a rater, occasional harsh marks on strong performances or generous marks on weak ones; for an examinee (like E14 at Infit = 1.59), unusually uneven scores across criteria or raters. | Do not automatically delete raters or students from one number. Check rating counts first, inspect original ratings, and review rubric wording or rater calibration notes. |
**Far to the left (< 1.0, overfit / muted, e.g., 0.5–0.7)** | Less variation than expected: Often reflects central tendency (clinging to safe middle scores like 2 and 3) or halo effects (giving identical marks across all four criteria). | Inspect Observed Category Use and rater score distributions to see whether middle bands are overused. |
5.3 Category Probability Curves — Is Your Rubric Working?
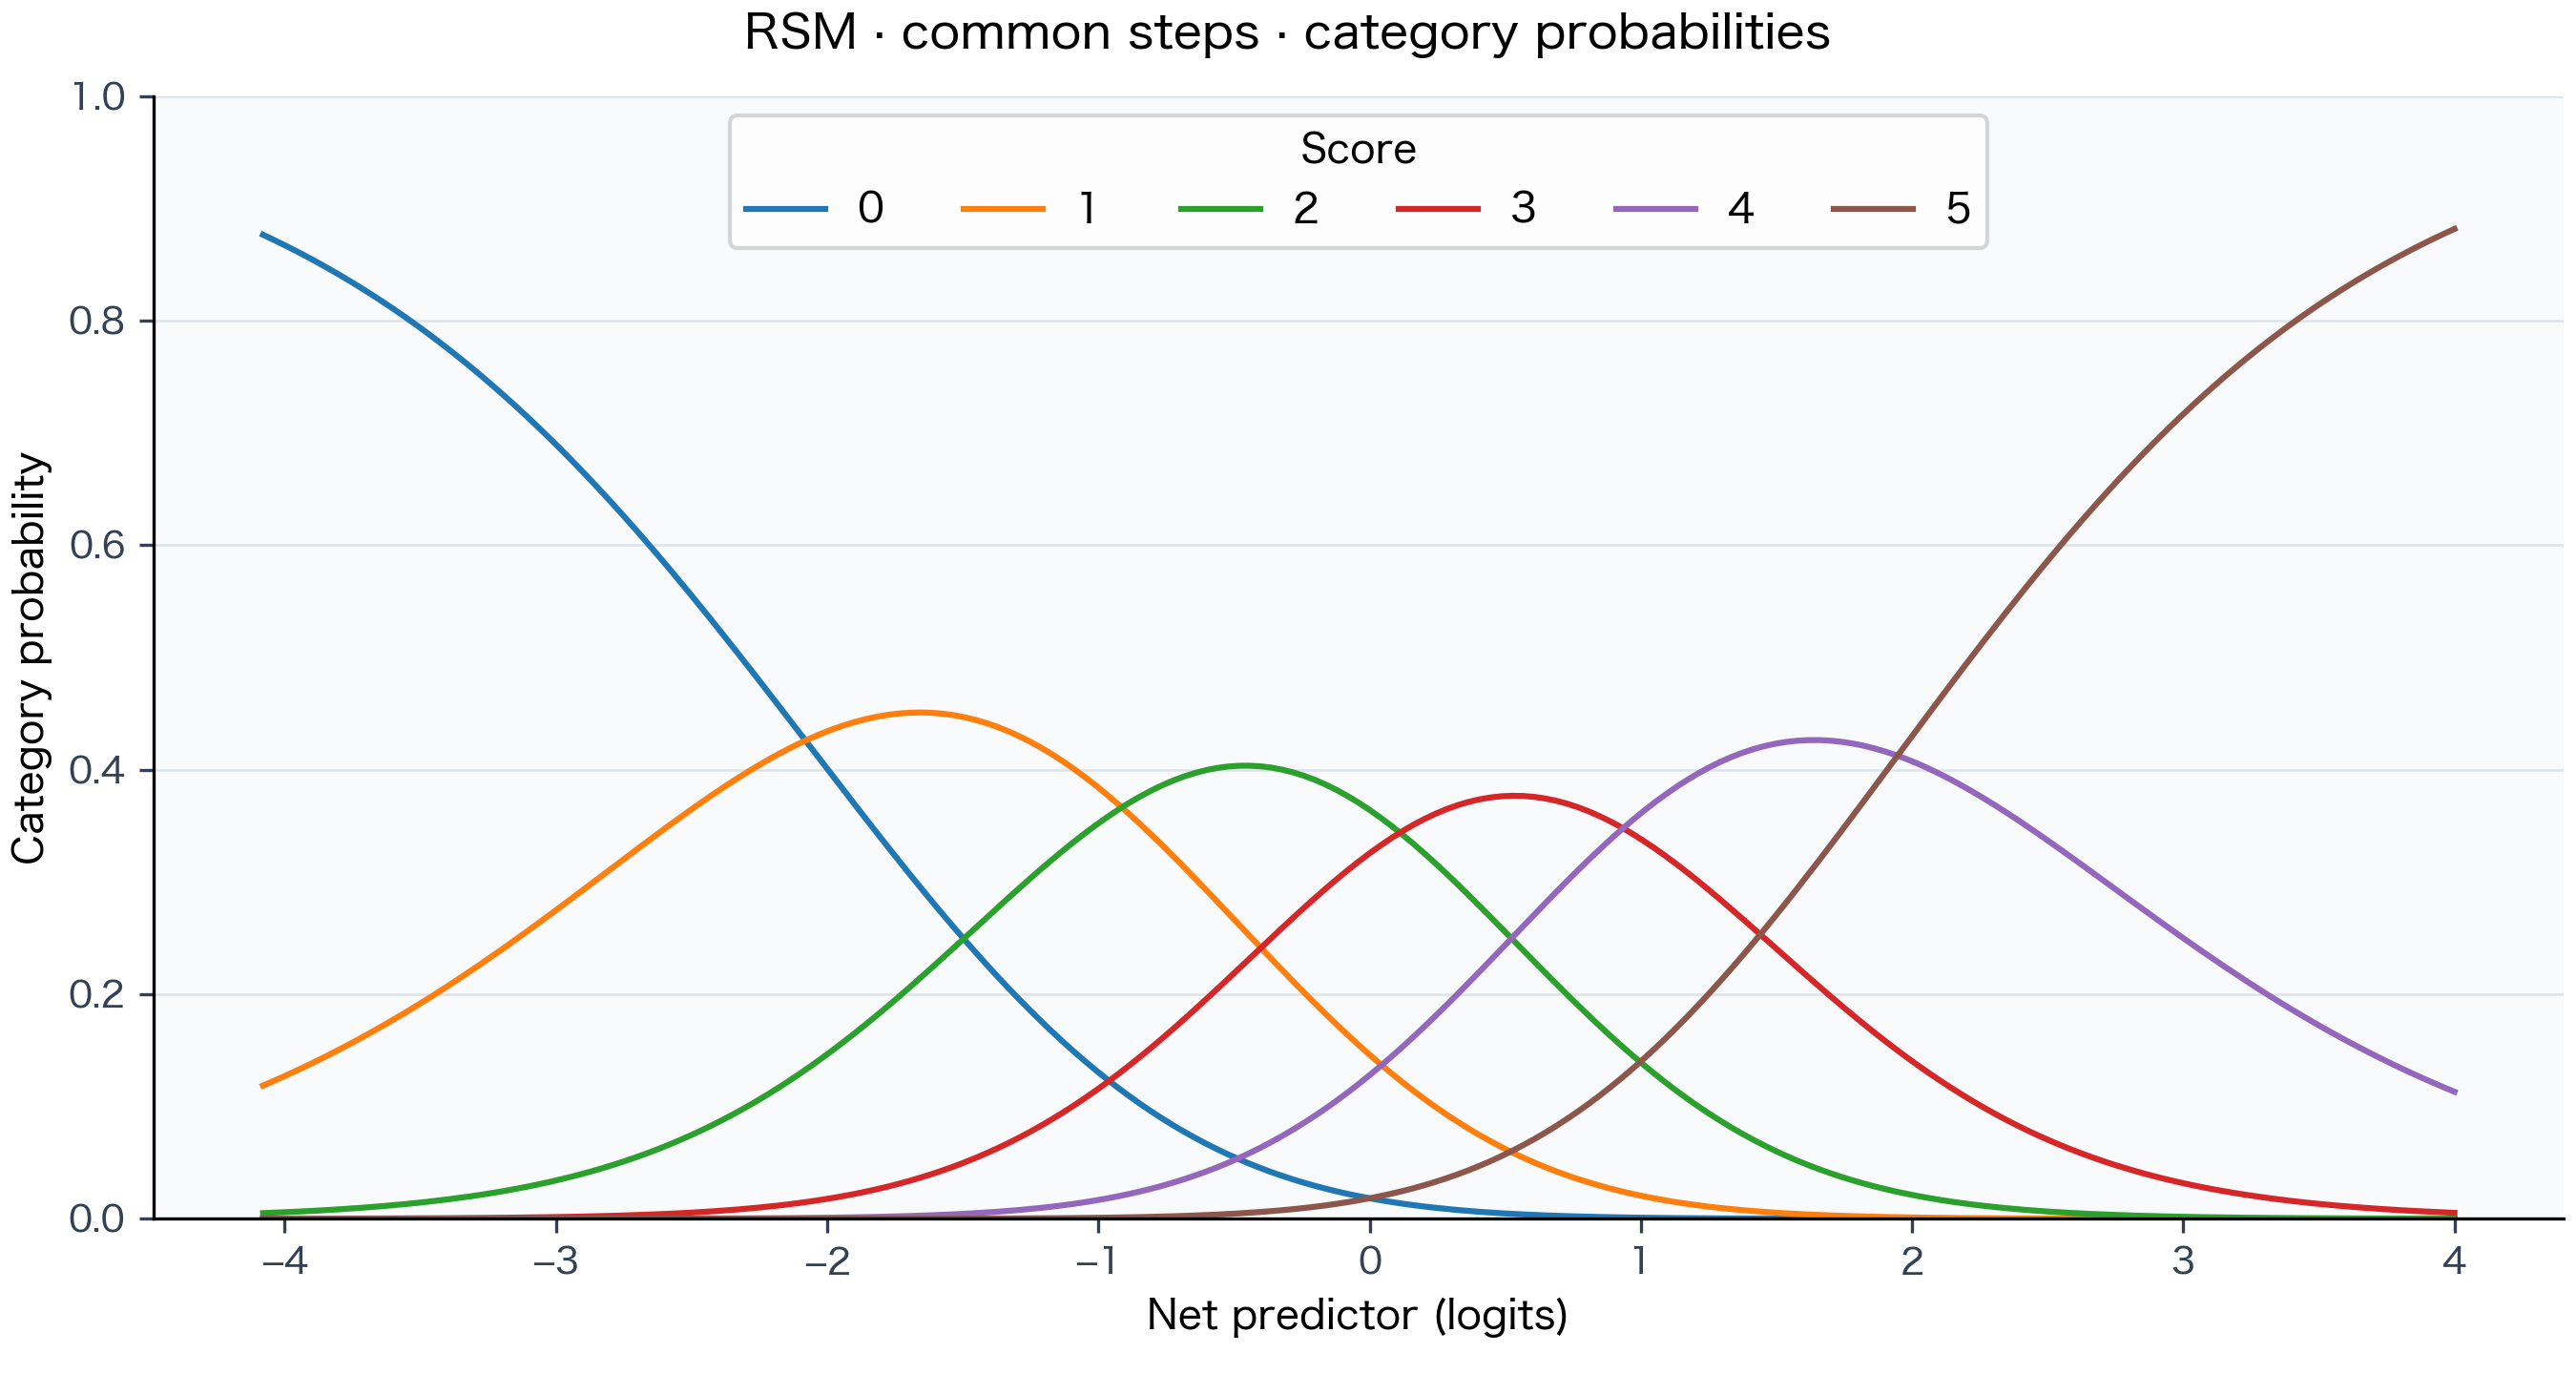
| Curve pattern | What it tells you about the rubric | Recommended check |
|---|---|---|
Each score (0–5) rises to its own distinct peak in order from left to right | Every rubric category represents a genuine, ordered performance zone as examinee ability rises relative to task/rater difficulty. | Confirm adequate counts per category in Table → Observed Category Use. |
| A middle curve is squashed beneath neighboring curves or thresholds cross | Raters are not distinguishing that score band cleanly from adjacent bands, or very few observations fell in that category. | Check Observed Category Use (sparse counts make step estimates unstable), review rubric descriptors, or test PCM if only one criterion has collapsed categories. |
5.4 Conditional Bias Heatmap vs. Specified Intervals & Joint Interaction
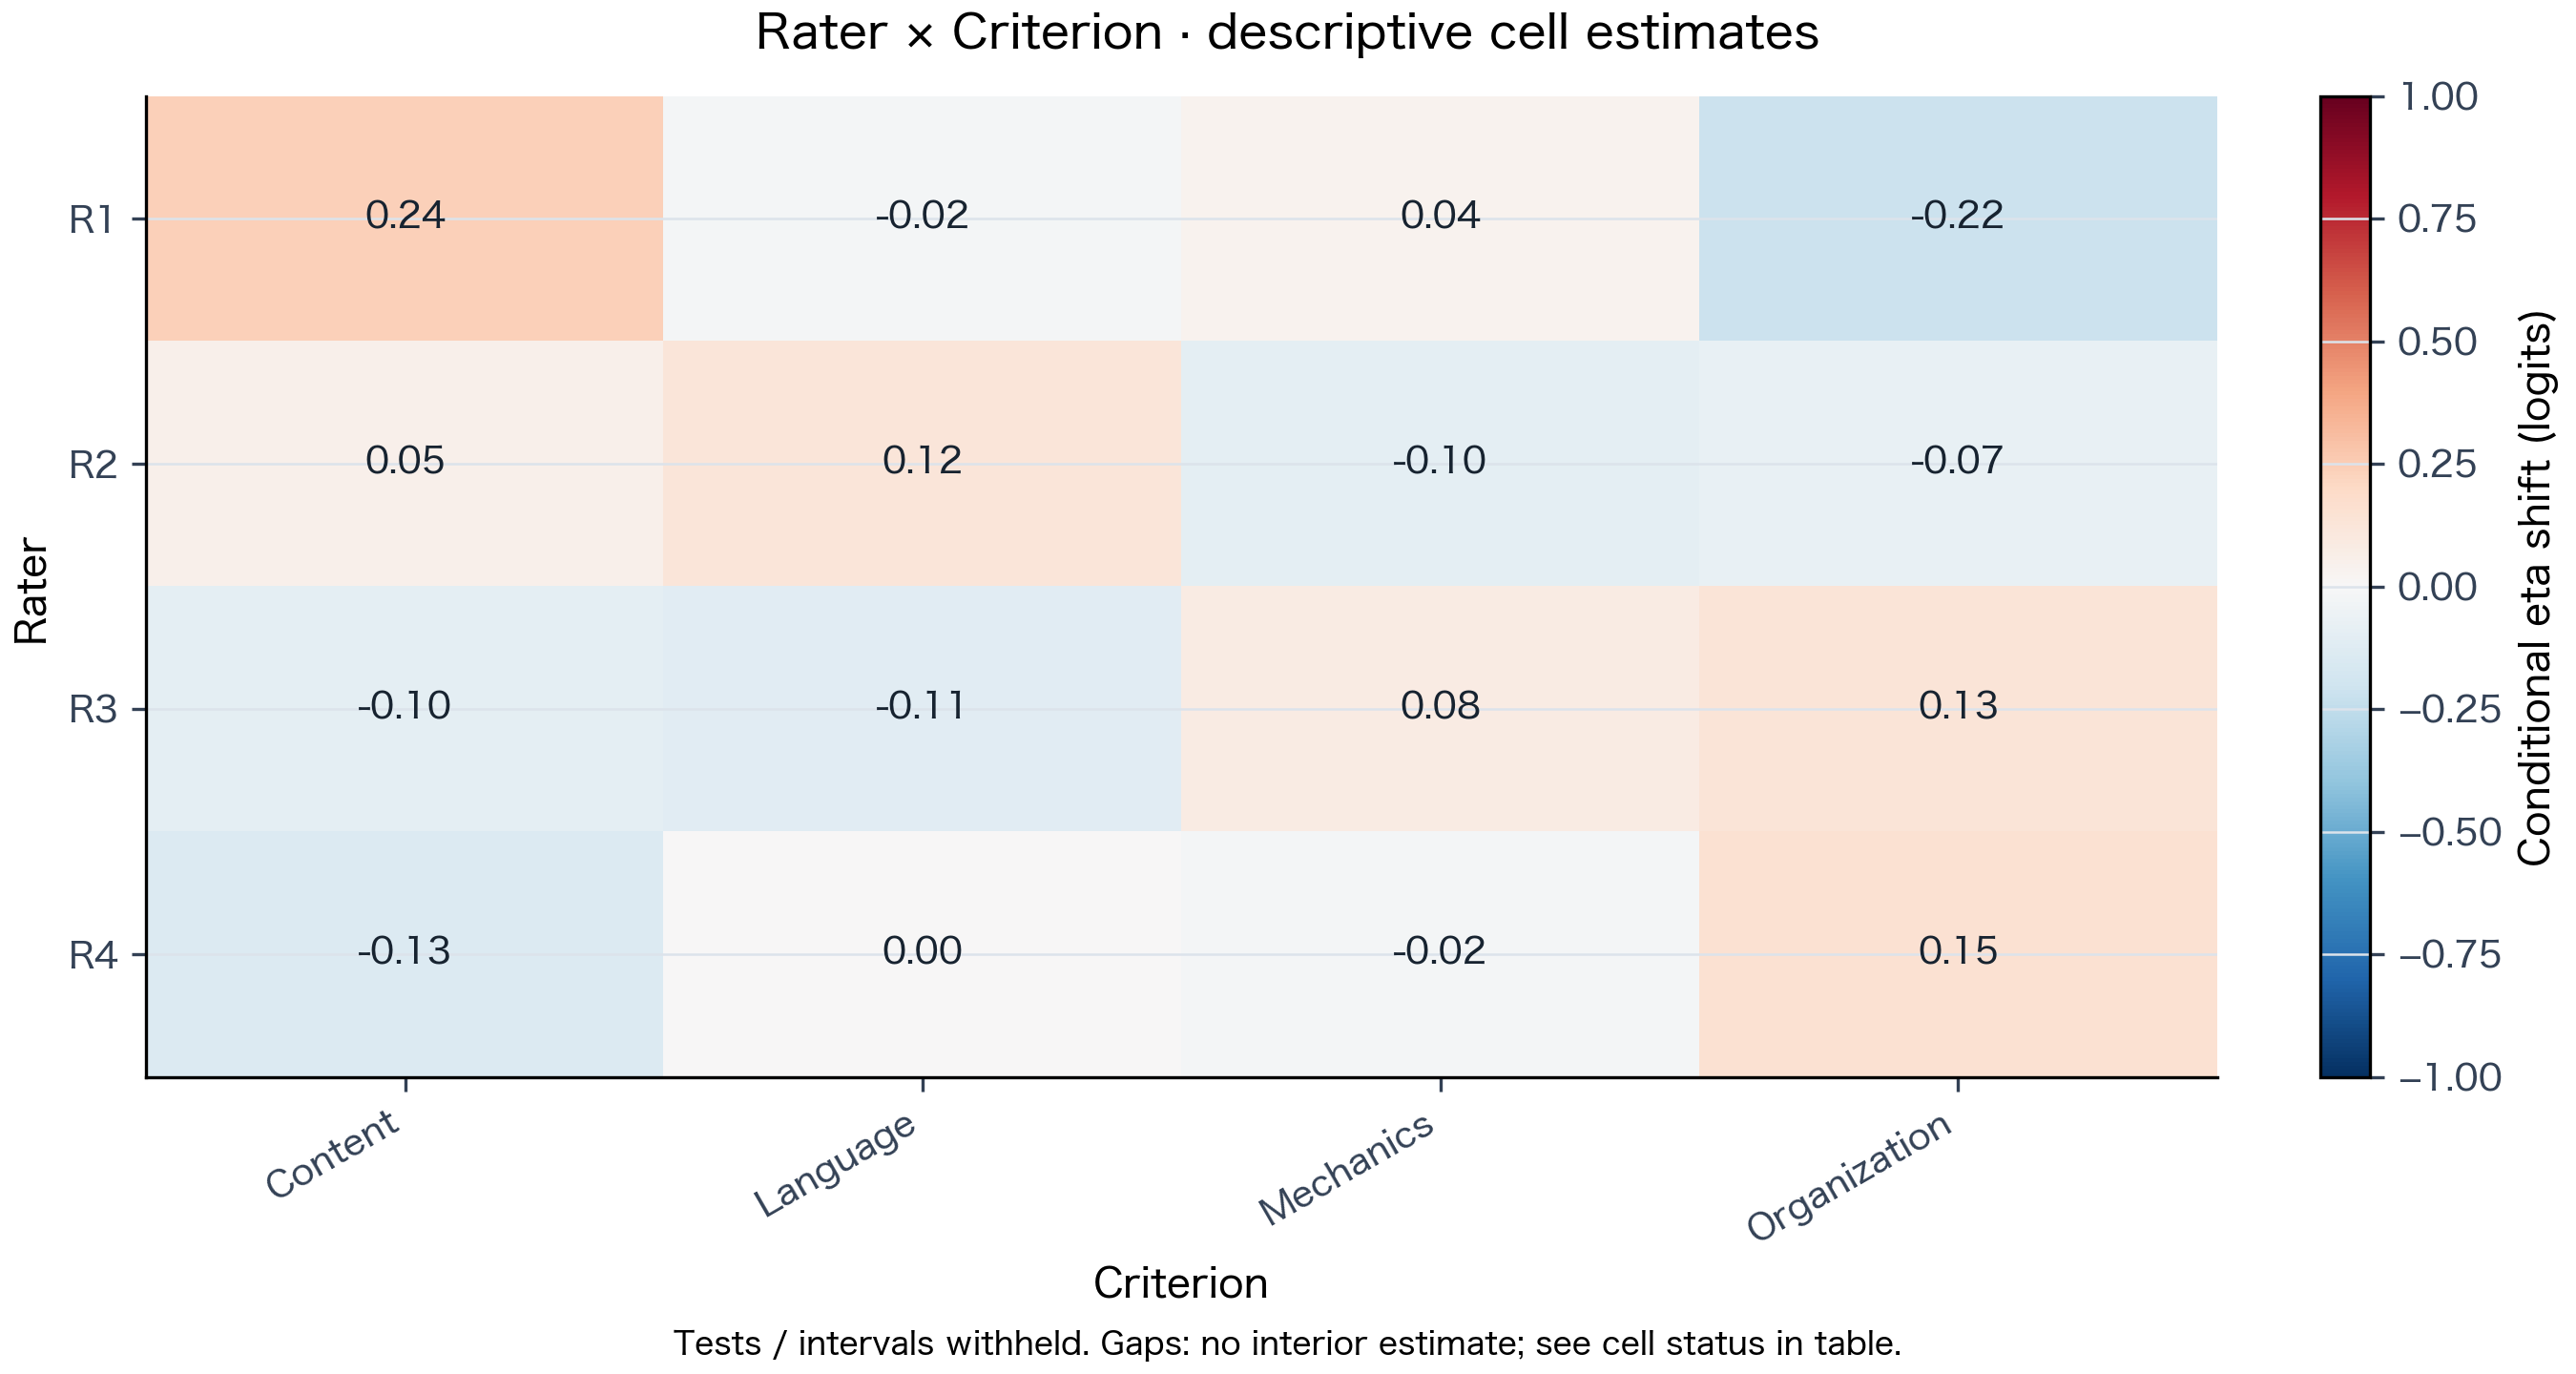
- Reading the Conditional Bias Heatmap (
Rater × Criterionabove):- Numbers near
0.00mean that pairing behaves just as expected from the rater's overall severity plus the criterion's overall difficulty. - Non-zero shifts (e.g.,
R1 × Content = +0.24vs.R1 × Organization = -0.22) describe how that cell's observed scores deviate when main calibration is held fixed; gray cells mark pairs without an interior estimate (always check cell counts and status in the table!). - Thesis writing caution: Conditional bias heatmaps are exploratory screening maps, NOT statistical proof of bias or fairness (
Tests / intervals withheld). Write "CellR1 × Contentshowed a descriptive shift of +0.24 logits with main calibration fixed, prompting qualitative review of rubric exemplars"—not "Rater 1 was significantly biased."
- Numbers near
- When you need model-based uncertainty intervals:
- Use Specified intervals (fixed-SD MML) for a structural facet's levels or a prespecified
A − Bcontrast, or Joint interaction (fixed-N(0,1)MML) to refit main effects, steps, and one interaction together. - If a target passes numerical checks, pointwise approximate intervals are plotted; if withheld (blank in table or reason shown on chart), report it as unavailable rather than zero—and remember numerical screens do not guarantee finite-sample coverage or simultaneous intervals.
- Use Specified intervals (fixed-SD MML) for a structural facet's levels or a prespecified
5.5 D-Study Curves — Planning Rater and Task Counts (G and Phi)
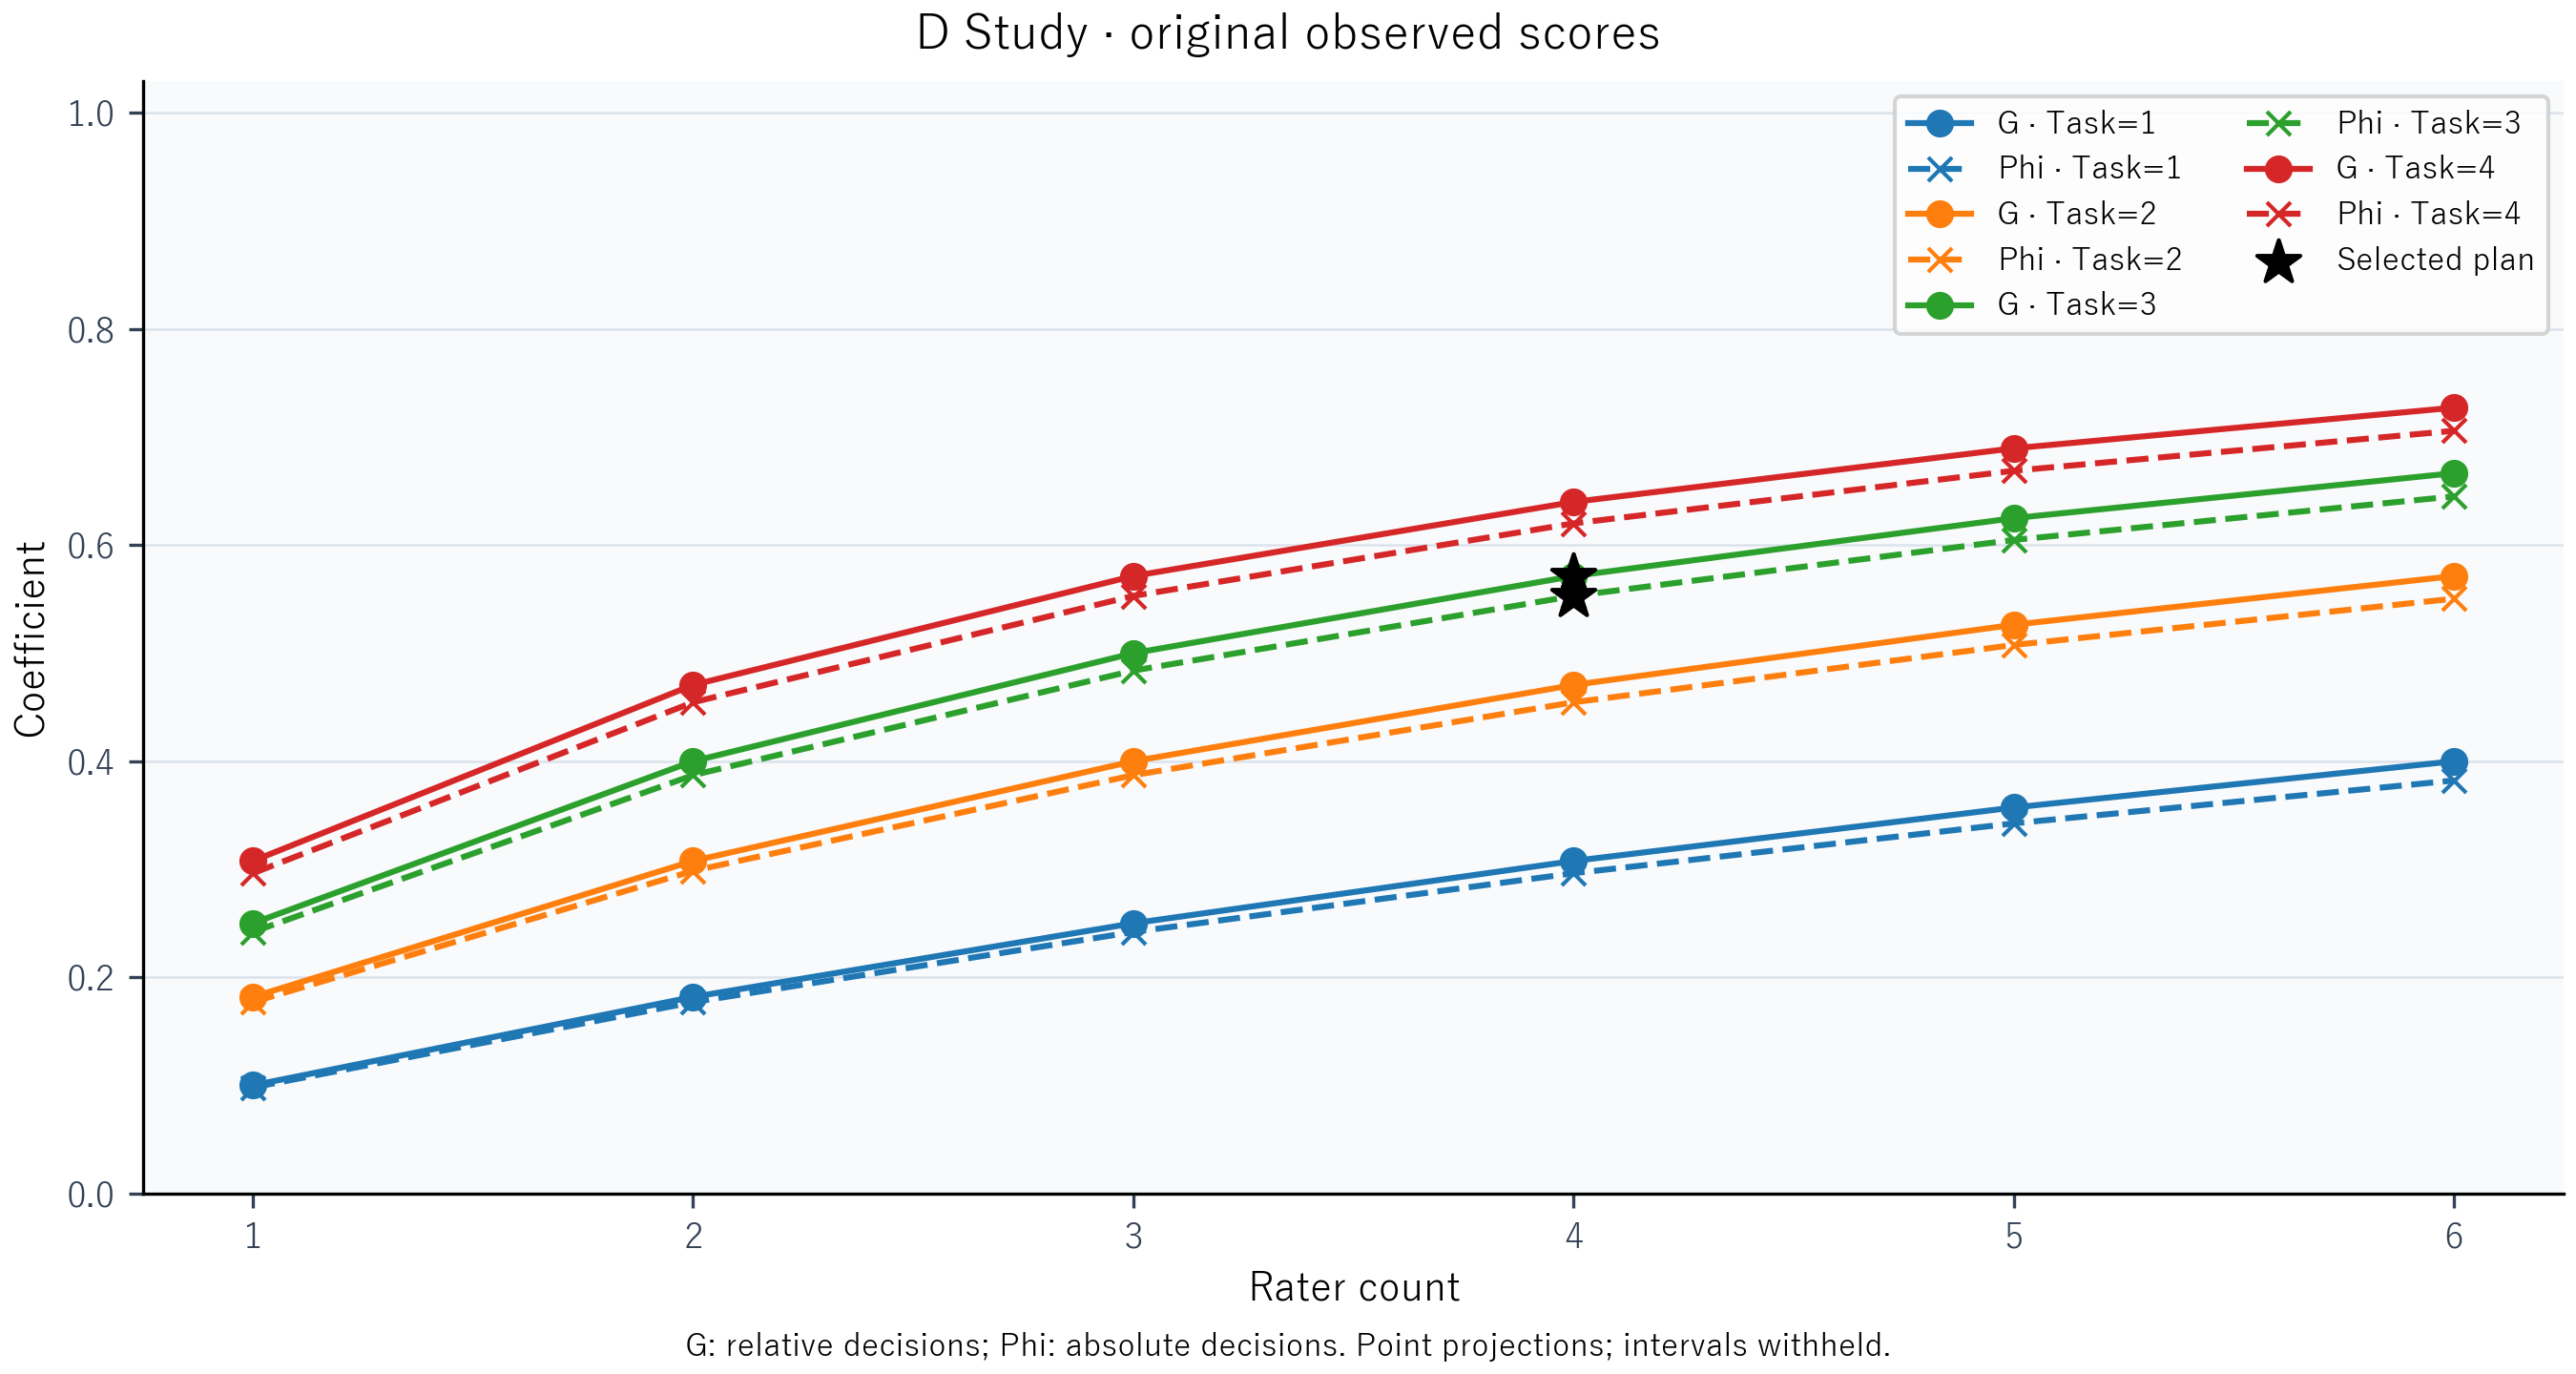
| What to compare on the D-Study chart | Practical interpretation | Example from GD_ANOVA.mfrm above |
|---|---|---|
Solid lines (G) vs. dashed lines (Phi) | G (generalizability) applies to relative rank-order decisions (e.g., ranking candidates); Phi (dependability) applies to absolute cut-score decisions (e.g., passing at >= 70%, where overall rater/task severity or difficulty shifts also count as error, so Phi <= G). | Pick G or Phi based on how scores will actually be used, and check signed + zero-clipped variance components in the table. |
Gap between Task = 1, 2, 3, 4 lines vs. slope along Rater count = 1..6 | Compare combinations with the same rating budget (e.g., 6 ratings per person) and check the variance-component table: when person × task variance is large, higher-task curves pull well above Task = 1; when residual (person × rater × task) variance dominates, total raters × tasks drives the gain. | Moving from 1 task × 4 raters (G ≈ 0.31) to 3 tasks × 4 raters (★ Selected plan, G ≈ 0.57) or 4 tasks × 4 raters (G ≈ 0.64) substantially boosts reliability, while 6-rating options (1×6, 2×3, 3×2) cluster near G ≈ 0.40 because residual variance dominates in this synthetic example. |
(Reminder: G/D requires complete, balanced 1–2 random-facet observed-score designs with 1 observation per cell and unit weights; G and Phi are point projections without confidence intervals, and benchmarks like 0.80 depend on assessment stakes rather than acting as universal rules. See Analyses, interpretation and reporting limits for full details.)
6. Save, Export Manuscript Figures, and Reopen Projects
| Goal | Action & format | Key detail |
|---|---|---|
| Resume work later without recalculating | Save project → .mfrm | Bundles input data, identifiers, settings, and results; reopen via Data → Open project with zero re-estimation. |
| Read or share all tables & plots offline | Save report → .html | Opens in any web browser with embedded vector figures and full methodological notes. |
| Place clean figures in a thesis or journal paper | Save figure… → .png (300 DPI) or .svg | Switch Figure presentation to Manuscript to move titles and long notes into an accompanying .caption.txt file. |
| Analyze tables in Excel, R, or Python | Save CSV… → .csv | Exports the selected table together with its qualification and interpretation notes. |
Using Manuscript Figure Mode Properly
- Explanatory (default): Keeps the figure title and caution footer inside the image so slides and working notes stay self-contained.
- Manuscript: Moves the overall title and long caution prose outside the graphic while retaining axis labels, legends, data labels, and any withheld-output notice. Use Title and note to copy the text, and always carry the saved
.caption.txtcontent into your thesis or manuscript figure note so statistical conditions are never lost. (Check your target journal's or APA's specific layout guidelines.)
Safe Project Reopening & Version Updates
- Open saved
.mfrmprojects through Data → Open project (one project at a time; portable Windows builds do not register.mfrmfile associations in Windows). Images and HTML reports cannot restore an interactive session. - Editing controls in Settings does not overwrite displayed results—a notice reminds you that shown outputs belong to the previous analysis until you click Analyze.
- Backups across versions: This version reads older basic
.mfrmprojects without altering them, whereas older applications cannot open extended (schema 2) projects saved by this version, and reopened interval records check matching source/runtime conditions. Keep untouched copies of your previous app folder and original.mfrmfiles before testing a new build in a separate folder. Review.mfrmfiles and reports for student/rater IDs before sharing.
7. Troubleshooting
| Situation | What to check & do |
|---|---|
MFRM-Desktop.exe will not open on Windows | Confirm you ran Extract All, kept MFRM-Desktop.exe next to _internal, and are on Windows 11 x64. If Windows blocks the unsigned preview, record the exact message rather than disabling security protections. |
macOS blocks an unnotarized .app bundle | Run from Python source (instructions), or—only after verifying source and SHA-256 on a Mac that permits it—follow Apple's Open Anyway guidance without disabling Gatekeeper. |
| CSV fails to import or non-English text is garbled | Re-save from Excel as CSV UTF-8 (Comma delimited) and verify unique, non-empty column headers in row 1. |
Analyze keeps you on Settings | Follow the validation message: check for overlapping column roles, decimal/out-of-range scores, or Rubric maximum <= minimum. |
| Fewer rows were analyzed than expected | Review the pre-run message for rows excluded due to blank/non-numeric scores or missing IDs, and check duplicate facet combinations. |
A bias heatmap or interval plot is missing in Results | In Settings → Bias / intervals, click Add so the request appears in the list (or check Add to next analysis with MML and fixed SD 1 for Joint interaction), then click Analyze. |
A Specified interval is withheld due to data or numerical checks | Read the table's Reason column: disconnected rating groups, extreme all-min/all-max scores, stopping tolerance, or quadrature resolution (MML quadrature points) can withhold intervals. A point estimate alone does not establish a significant difference. |
An SE or interval is blank for a whole table/method | Blank means unavailable, never zero uncertainty. General MML tables, person-score uncertainty, and G/D intervals are restricted by current method scope—rerunning the same data will not unlock them. Check analysis_scope.md for supported alternatives. |
| Changing settings did not update the displayed chart | Save any output you need from the previous run, verify the new settings, and click Analyze. |
| You need to stop a running fit | Click Cancel; any prior completed result in your session is preserved. |
For bug reports, please email the author, Ryuya Komuro, at ryuya.komuro.c4@tohoku.ac.jp with your OS, app version (0.2.19-beta), archive filename, steps to reproduce, and exact error message—never include confidential or identifiable examinee/rater data in emails, files, or screenshots.