
Start with one analysis: load ratings, fit a model, plot the results, and read the summary. The Examples section contains a complete runnable script. The later sections describe diagnostics, reporting, and specialist routes.
See online networks and reporting guide for Lamprianou-inspired network
views, the FACETS/ConQuest reporting crosswalk and speaking/writing examples
combining MFRM with G/D studies. plot_data() supports long-format extraction
and original-value cluster profiles for custom distribution plots.
Offline tutorials and online articles
Five core tutorials are included with the package; list them with
vignette(package = "mfrmr"). Specialist guides are online articles and
cannot be opened with vignette(). Follow their links below.
The main website documents the published release. Compare its version
label with packageVersion("mfrmr"): development changes may only be
described in the installed help until matching website pages are published.
Connect the question to the result
These are alternative or complementary branches, not requirements to run every function. Start from the intended score, rating unit, rubric endpoints and the decision the study needs to support.
| Question | Connected route |
| What was rated, and can the groups be linked? |
describe_mfrm_data() and subset_connectivity_report() with raw data/column arguments before fitting; build_mfrm_network_review() adds graph summaries. Graph connectivity does not establish identification. |
| How do persons and named facets differ? |
fit_mfrm() -> diagnose_mfrm() and eligible intervals -> mfrm_results() -> mfrm_report(). Keep Separation, Strata and Reliability distinct from observed agreement. |
| How many raters/tasks does the reported score need? |
mfrm_g_study() -> mfrm_d_study() -> summary(), plot() and eligible mfrm_multivariate_d_compare(). No MFRM fit is required. |
| Do raters agree? | Matched units -> pairwise_kappa_table() for pairs, krippendorff_alpha_table() for a declared panel target, or a justified ICC/AC2 definition. Retain overlap and exclusions. |
| Can a scale be reused? |
review_mfrm_anchors() -> anchored fit / build_linking_review() -> plots and build_summary_table_bundle(). Retain anchor provenance, scale and uncertainty. |
| Does a combination or group need follow-up? | Specified estimate_bias() or analyze_dff() -> signed tables and plots -> matching reporting tools. A screen is not a fairness verdict. |
| Does model choice change the answer? | Comparable fits -> compare_mfrm() -> build_model_choice_review() -> build_summary_table_bundle(). AIC and LRT have different eligibility conditions. |
| What remains unexplained? |
analyze_residual_pca() / q3_statistic() for residual structure; separately mfrm_features() and clustering for declared entity attributes. mfrm_residual_network() supplies signed residual correlations and optional hierarchical groups, followed by mfrm_report(). It is not EGA. |
A Criterion facet in one-dimensional MFRM adjusts criterion locations and,
when specified, steps/slopes; it does not create separate Person dimensions.
Several scores in mfrm_g_study() are fixed score components with
source-specific covariance matrices, not additional random facets. Read
vignette("mfrmr-gtheory") for the criterion/facet distinction and the
report structure. Pass G/D objects directly to mfrm_report() and
build_summary_table_bundle(); supplied saved intervals retain source context.
The editable templates/gtheory-report.Rmd joins tables, plots and exports.
Higher coded scores need not mean better performance. For Comprehensibility,
record whether they mean greater ease or greater difficulty. positive_facets
changes parameter orientation, not outcome coding. Keep coding consistent
with anchors and report labels; see mfrmr_visual_diagnostics. The
online networks and reporting guide supplies richer network and custom
distribution examples, plus literature-based reporting connections. The
workflow vignette places assignment networks at design review and score
networks alongside observed agreement. Neither is a residual graph.
The question-to-report map in vignette("mfrmr-reporting-and-apa") identifies
which sections exist, which remain standalone, and what to report together.
Choose a reading path
To choose a model and estimator before fitting, read
vignette("mfrmr-model-choice", package = "mfrmr") or the
online decision guide.
It connects assessment questions to the available routes and explains why
starting with the most complex model is not automatically preferable.
For a first analysis, read Start here, run the Examples, then read
From the first summary to diagnostics. You do not need to work through
every specialist route. For your own file, use Use your own ratings and
the workflow vignette's CSV lesson. For an unfamiliar result or formula,
open mfrmr_methods_reference: it links questions to calculations, their
limits and original references. Use mfrmr_output_guide("intervals") when the
question specifically concerns uncertainty.
Choose by purpose and design
For named rater-severity or task-difficulty comparisons, consider fixed-facet RSM/PCM; CML avoids an ability-distribution assumption when structural comparisons are the target, but estimates neither Person scores nor a population SD. MML is the route for supported population and GPCM structural inference, with explicit population assumptions. JML is useful for joint points and matched FACETS comparisons; fixed-exposure bias limits structural inference. Corrected JML is an experimental shared-owner GPCM route, not a general RSM/PCM correction or a guarantee of true-parameter interval coverage.
Use PCM when separate category-step patterns answer the question; use GPCM
when discrimination differences matter and the design can distinguish them.
Free slopes do not automatically model dependence. Known Person-specific
block dependence or a shared sampled-rater population can instead justify
fit_mfrm_testlet() or fit_mfrm_random_rater() from the outset.
These extensions have different targets and supported outputs.
A larger model can contain a simpler one without estimating its restrictions
exactly in finite samples; extra effects require information and can add
uncertainty. Choose the structure justified by the question and design,
not complexity alone. See mfrmr_methods_reference for assumptions and
mfrmr_output_guide("intervals") for uncertainty availability.
Start here
Load the package with
library(mfrmr)and example ratings withratings <- load_mfrmr_data("example_operational").Fit with
fit_mfrm(). Theperson,facets, andscorearguments name columns in the data; each row represents one rating event.Draw the Wright map with
plot(fit)to view person abilities, rater severities, criterion difficulties, and category thresholds together.Save
results <- summary(fit)and inspectresults$person_overviewandresults$facet_overviewfor the distributions of estimates.
These overview tables summarize distributions. Use as.data.frame(fit)
for individual person, rater, and criterion estimates, identified by
Facet and Level. Before interpreting or reporting estimates, read
results$decision and follow its NextAction; the default summary does
not compute diagnostics. For your own data, first check the rating design
and score categories with describe_mfrm_data().
head(ratings) shows the input rows; Study and Group are extra labels unused
by this model. <- saves an object and $ selects a named part of it.
ratings is the name used in this example, not a required object that you
must prepare beforehand. The loading line creates it from packaged synthetic
data. Use that line first; after the example works, replace it with your own
data import and review the column names and score categories.
From the first summary to diagnostics
The ordinary workflow below uses MML/JML mfrm_fit results. Native
fit_mfrm(method = "CML", category_policy = "preserve") instead returns a
dedicated RSM/PCM structural-parameter result: use summary(fit)$locations,
summary(fit)$steps and mfrm_facet_intervals(), then plot(ci) and RDS
saving. CML conditions out Person abilities and estimates no population SD;
ordinary scoring, diagnostics and consolidated reports do not apply.
See online facet-interval guide for its executable comparison example.
For a deficient school/rater assignment, declare CML comparisons with
describe_mfrm_data() and use fit_scope = "comparisons"; summary(fit)
then reports only requested contrasts, with conditional-information intervals
for identifiable targets and missing values for others. See
online linking and DFF guide for that separate workflow.
A FormalInference = "No" entry in results$decision can mean that precision
has not yet been reviewed. Read Why and NextAction to distinguish that
state from a detected problem. Run diagnostics <- diagnose_mfrm(fit) and
inspect summary(diagnostics)$decision. To reuse these checks in the fuller
reporting object, call res <- mfrm_results(fit, diagnostics = diagnostics).
Here results is the basic summary and res is the comprehensive object
accepted by mfrm_report() and export_mfrm_results().
Understand the function names
Learn the operation first, then open its help page:
fit_estimates model parameters, for examplefit_mfrm().score_estimates Person abilities using a fitted calibration, for examplescore_mfrm_persons()for people already in a supported fitted RSM.pool_combines eligible analyses, for examplepool_mfrm_imputed().review_checks supplied data or analysis choices, for examplereview_mfrm_imputations(); it does not generate missing scores.export_writes files, for exampleexport_mfrm_results().summary(object)andplot(object)select a method for the object you supply. You normally do not callplot.mfrm_testlet()directly.
The package name is mfrmr; mfrm in analysis functions refers to a
many-facet Rasch model. Some help guides use the package prefix mfrmr_.
The prefixes do not select different estimators. For a short ordinary-MFRM
map, use mfrmr_output_guide("beginner")[, c("Question", "MainFunction")].
The no-argument guide lists all specialist routes and is not a first lesson.
For rater feedback, use mfrmr_output_guide("feedback"): it distinguishes
uncertainty in severity from unexpected rating patterns and the accuracy
of a warning rule. mfrm_facet_intervals() concerns specified fixed raters;
shared-rater intervals have a different target and retain their separate
limitations. Ordinary and extended-model residuals also use different
definitions. The guide names the matching summary, plot and saving routes.
review_mfrm_imputations() checks completed
data supplied by you; it does not generate missing scores. Follow it with
fit_mfrm_imputed() and then pool_mfrm_imputed().
mfrm_screening_performance() evaluates a warning rule against known
simulation truth. mfrm_screening_sensitivity() repeats that evaluation
across specified thresholds; it does not establish accuracy from real
ratings alone. mfrm_pca() summarizes numeric external attributes;
mfrm_cluster() forms groups: choose method = "kmeans" for numeric
attributes, "pam" (the default) for mixed attributes, or "hierarchical"
for a Gower dendrogram. PCA is optional before k-means. The method is an
explicit choice, not automatically selected from the data.
A G-study (mfrm_g_study()) estimates sources of variation in
observed scores; a D-study (mfrm_d_study()) uses them to
compare future rater/task plans. Neither needs an MFRM fit.
Updating earlier scripts
| Earlier call | Recommended call | Meaning retained |
mfrm_cluster_pam(x, k) |
mfrm_cluster(x, k, method = "pam") |
Same Gower/PAM partition and result class. |
mfrm_response_imputations(..., impute = ids) |
review_mfrm_imputations(..., impute_ids = ids) |
Same checks of supplied completed ratings; no imputation model is fitted. |
keep_original = TRUE |
category_policy = "preserve" |
Same category ladder in fitting, data review and anchor review. |
keep_original = FALSE |
category_policy = "collapse" |
Same collapsing of gaps; still the default when no policy is supplied. |
The former clustering and imputation-review names are no longer exported
in the 0.3.0 development series; see mfrmr_api_migration_030. The category
argument aliases remain supported. Saved objects retain their classes and
summary()/plot() methods. Do not pass conflicting old/new category choices.
See compatibility_alias_table() for alias status. This does not change what predict() returns:
use the ability-scoring or response-prediction route named for your model.
The former standalone drawing plot_*() functions have a different policy:
they are no longer exported in 0.2.4. Use result-object plot() and
mfrmr_plot_migration to update those calls.
A calibration is the fitted set of model parameters, such as rater severity and category thresholds. A conditional ability interval holds them fixed; it excludes uncertainty from estimating the calibration. EAP is the mean of the conditional ability distribution. An SE describes uncertainty in an estimate; an SD describes spread. Check whether an SD refers to differences among persons or one Person's posterior.
Check defaults before adapting an example
An omitted argument selects a convention, not the best choice for your assessment. Start with the choices that change the analysis:
Model and population:
fit_mfrm()defaults to RSM and MML. RSM uses shared category thresholds. With PCM, setstep_facetexplicitly instead of relying on facet-name inference or the first-facet fallback. Ordinary RSM/PCM MML withpopulation_formula = NULLfixes the ability distribution at N(0,1). Both extended RSMs instead estimate ability variance by default (person_sd = NULL). Their model-comparison tutorials show how to match population assumptions. Changing only the fitting function can change more than the rater/dependence structure.Estimator choice: MML is the current default, not the result of an automatic comparison of estimators. It uses a population model for abilities. JML estimates each person's ability as a separate parameter; it does not fit a population distribution during calibration. Choosing JML does not automatically correct the bias associated with few ratings per person. Without
jml_correction_order, JML is uncorrected and its location SEs are exploratory. Shared-owner GPCM also supports an explicit, experimental correction order. ItsRootSEdescribes local variation around the adjusted-equation root; residual bias may remain and structural confidence intervals are not supplied. See the estimator discussion infit_mfrm(). Neither a larger model nor a smaller reported SE establishes a better analysis. Choose from the assessment question, rating design and modeling assumptions, rather than from whether the user is a beginner or expert.Rating scale: supply
rating_min,rating_maxandcategory_policyfrom the rubric in both data review and ordinary fitting. Omitted bounds use the observed range. The ordinary defaultcategory_policy = NULLretainskeep_original = FALSEand can collapse unobserved internal categories, for example observed 1, 3, 5 to 1, 2, 3. This changes the fitted category structure, not just labels. A warning and the stored score map identify the recoding. InspectCategoryPolicyandScoreRecodedindata_review$overvieworsummary(fit)$settings_overviewto distinguish the chosen rule from an actual change to score values. With a complete contiguous scale,"collapse"can still haveScoreRecoded = FALSE. Usecategory_policy = "preserve"to preserve the declared ladder; an unsupported internal category then stops fitting and needs substantive review.Missingness and assignment: ordinary fitting excludes rows missing a score or required ID (and nonpositive-weight rows); inspect
fit$prep$row_retention,fit$prep$preparation_notesandfit$prep$score_map. Missing-code conversion is off unless requested. In contrast, the extended models stop on missing assigned scores by default, and feature/G-study routes also require an explicit omission choice. Omission does not correct informative missingness. Inreview_mfrm_imputations(),assigned = NULLdeclares every supplied row assigned: supply an assignment column if unassigned rows are present.Included effects: both extensions default to no additional fixed facets. For example,
testlet = "Task"groups local dependence but does not itself add fixed task difficulty; request that withfacets = "Task"when it is part of the intended model.Feature geometry: PCA and direct k-means default to
scale = TRUEand equal feature weights. Thus years of experience and hours of training contribute in SD units;scale = FALSEretains their measurement units. PAM/hierarchies instead use Gower scaling, including numeric ranges. Choosekexplicitly. PCA retains all numerically nonzero components unlesscomponentsis specified; no automatic reduction is implied. K-means on a PCA result reuses its fitted transformation.Planning: multivariate G-studies default to complete balanced crossed ANOVA. Incomplete or nested data need the documented explicit choices; the function does not silently choose another estimator or design. D-study
weights = NULLreports the original scores separately, not an equal-weight total. Supplied weights are not normalized: an average and a sum have different score/SEM units. Specifydesign_gridfor the plans you want to compare.Uncertainty and flags:
mfrm_facet_intervals()defaults tomethod = "model"; request"sandwich"explicitly, with the appropriate independent clusters. The default confidence level is pointwise 0.95, not simultaneous coverage across raters. Rubin pooling defaults todf_complete = Inf, a large-sample complete-data approximation, not a degrees-of-freedom estimate from the number of rating rows. Extended calibration bounds are omitted by default; conditional Person bounds describe a different target. Misfit bands can also depend on session options: inspectmfrm_misfit_thresholds()and the returned screening settings. Withfit_measures_table(), specifylower,upperandflag_basisto record a chosen rule. In a dashboard, numericmisfit_warnuses a reciprocal lower bound; it is not just a replacement upper bound. None of these conventions establishes a universal rater-quality threshold.
Then choose the workload and display. The default summary(fit) is a
lightweight fit summary; ordinary mfrm_results(fit) can compute missing
diagnostics. Use saved diagnostics or compute = "never" for review
without new diagnostics. Source-Person scoring requests everyone when
persons is omitted. K-means defaults to 25 starts with seed = 1, and
silhouette = TRUE adds pairwise distances; use FALSE when that optional
calculation is not needed. A fixed seed provides reproducibility, not
evidence that the partition is best. Plot styles, titles and labels affect
presentation; changing the model, feature scaling or thresholds requires
recomputing the affected analysis. Keep full result objects and their
resolved settings with the script, not only the visible tables. For ordinary
fits, start with summary(fit)$settings_overview; extended summaries also
expose settings and data_usage.
Use your own ratings
The "Use your own CSV" section of
vignette("mfrmr-workflow", package = "mfrmr") covers CSV import,
column-name mapping, and reshaping a sheet with separate criterion columns.
The following help pages are also available without an installed vignette:
describe_mfrm_data()explains input and retained row counts, category usage, connectedness, and how to follow up input problems.recode_missing_codes()shows how to replace documented missing-score markers while preserving person and rater IDs.summary.mfrm_data_description()shows a missing-score example and explains the full data checks versus their compact summary tables.
Set the score bounds from your rubric and use the same columns, bounds,
and category_policy setting for the review and the fit. Reviewing data does
not change the original ratings. After correcting or recoding them, repeat
the review and pass the corrected data frame to fit_mfrm(). A
data_review object contains checks; it is not the rating data to fit.
Choose which ratings share an effect
The routine fit/diagnose/results/report workflow starts with ordinary
RSM/PCM. Other fit_mfrm() models share the mfrm_fit class but have
different restrictions. Check mfrmr_output_guide("gpcm_capabilities"), mfrmr_gpcm_scope and
online GPCM scope guide for one-family GPCM,
two-family GPCM or corrected JML;
the latter two do not supply ordinary fit tests or Wright/Pathway maps.
Use mfrmr_output_guide("models") to compare:
Fixed facets:
fit_mfrm()describes the specified rater and task levels. For supported ordinary models, native diagnostics, Wright maps and comprehensive reports use the matchingmfrm_fitresult.Shared random raters:
fit_mfrm_random_rater()models one rater effect shared across all Persons rated by that rater. For abilities of source Persons, usescore_mfrm_persons().predict()instead gives score probabilities at supplied abilities for observed or replacement raters. See online random-rater guide.Person-specific testlets:
fit_mfrm_testlet()groups dependent ratings within each Person. Usescore_mfrm_persons()for abilities of source Persons;predict()also accepts a supplied rating table for scoring. Both hold fitted calibration fixed. A Rater column can specify fixed severity and local within-Person membership. See online testlet guide.
Choose the next call from the input and the quantity you need:
| Input and purpose | Entry |
| Source responses; estimate abilities in either extension | score_mfrm_persons() |
| Supplied shared-rater responses; estimate abilities | score_mfrm_random_rater(newdata = ...) |
| Supplied testlet responses; estimate abilities | predict(testlet_fit, newdata = ...) |
| Supplied abilities; predict shared-rater rating probabilities | predict(random_fit, ability = ...) |
For the last row, choose rater = "observed" or rater = "new" explicitly.
There is no corresponding supplied-ability prediction route for testlets.
A supplied scoring roster replaces source responses. In the shared-rater model, an existing rater ID alone does not retain that rater's earlier responses or saved conditional distribution; include all intended responses once. In the testlet model, a column used both for local membership and as a fixed facet still requires known fixed levels: a new Person can be scored, but a new fixed rater cannot be introduced by changing its testlet label.
Shared-rater ability scoring can be slow because each Person's calculation
uses the complete rating table. Start with a few actual IDs in persons;
this selects output rows without discarding other Persons' ratings. Omitting
persons requests everyone.
All three have summary(), plot(), plot_data() and ordinary RDS saving.
Extended-model plots additionally support as_ggplot(), preserving each
interval's target, prior-only symbols and unavailable rows. Check
mfrmr_output_guide("intervals") for each interval's target and limitations.
The two extended models have their own classes. mfrm_results() collects
their saved calibration, numerical checks and interval meanings; attach
separately computed predictions and random-rater intervals explicitly.
Calibration tables retain estimates and approximate SEs but omit bounds by
default. For either extension, confint(fit, parm = "calibration") explicitly
requests pointwise normal approximations with unestablished finite-sample
coverage. Use mfrm_results(fit, calibration_intervals = "normal", calibration_level = 0.95) to retain that choice in reports and saved output.
mfrm_report() and export_mfrm_results() reuse these results without
fitting, scoring or resampling. Older predictions need regeneration from
the saved fit to carry matching source metadata; no refit is needed.
diagnose_mfrm(), the viewer, ordinary Wright maps, response-MI pooling
and portable-calibration extraction do not accept these model classes.
mfrm_response_diagnostics() separately integrates latent uncertainty to
produce same-data posterior predictive residuals and descriptive Infit/Outfit
for either extension. Paired/scatter plots have no reference cutoffs;
ordinary plug-in fit values are not directly comparable. Attach saved output
with mfrm_results(fit, diagnostics = response_review); no integration runs
during reporting. Numerical checks are not substitute model-fit diagnostics. Refit when
changing the statistical model; editing a saved object's class is invalid.
Replotting or exporting an existing table does not require refitting.
Assessment planning and external features
To compare tasks, raters or score weights using numeric observed scores,
start with mfrm_g_study() and mfrm_d_study().
Their help covers crossed facets, task-specific rater teams, incomplete
source designs and reading G/Phi/SEM plots. For prespecified plan differences
under normal random effects with two crossed facets, see
mfrm_multivariate_d_compare(). These analyses do not require an MFRM fit
and do not estimate reliability on its latent scale.
In particular, a testlet variance is on the latent logit scale and cannot
be substituted for an observed-score G-study component. Start G/D analyses
from the ratings and their declared G-study design.
Multivariate here means several observed score criteria, such as fluency
and accuracy, whose source-specific covariances are estimated together.
Multiple GPCM slope owners still describe a single latent ability.
Both provisional two-family MML engines support summaries and conditional
fitted curves with saved reports, separately checked experimental component
log-Wald and location/contrast intervals, and descriptive posterior residuals.
Component profiles preserve the fitted fixed-grid or adaptive integration;
every constrained solution needs its own numerical checks. Separately checked fitted-object
and portable new-Person EAP intervals condition on the calibration and prior;
they exclude calibration uncertainty and have unqualified coverage and
population transport. Neither inherits the one-family
diagnostic/inference workflow below. See mfrmr_output_guide("gpcm_capabilities"), mfrmr_gpcm_scope and the
Two slope families section in fit_mfrm().
Neither the estimated slopes nor their sampling covariance can substitute
for G-study score covariance components. Score weights specify the intended
composite; they are not discrimination estimates. There is no automatic
GMFRM-to-G-study conversion or joint estimation in these APIs.
Hirai and Koizumi (2013, doi:10.1080/15434303.2013.824973
) illustrate
complementary multivariate G-theory and MFRM analyses. Their G-study omitted
raters, so its generalization scope differs from a person-by-rater-by-task
analysis. For the relationship and literature, see
online GPCM scope guide.
Does MFRM simulation replace a G-study? Not automatically, and an analysis need not use both. Choose the score and decision first:
A G/D-study asks how a specified observed mean/composite generalizes over sampled tasks, raters or other supported conditions. Its variance and covariance components include interactions; relative and absolute error definitions determine G, Phi and SEM. Future counts reweight these components without repeatedly generating ratings and refitting MFRM.
evaluate_mfrm_design()generates ordered ratings under a declared MFRM specification, refits models and summarizes recovery, separation and fit screens. It asks how that procedure behaves under those assumptions. Increasing repetitions reduces Monte Carlo error, not uncertainty about an incorrect generating model or whether future raters are exchangeable.If the decision concerns calibrated latent scores, a suitably specified simulation may be sufficient. If it concerns the dependability of a raw mean or composite, a G-study provides that target directly. Simulation can also evaluate an observed-score target, but it must explicitly define the score, sampling universe, dependence and error criterion; a facet separation coefficient is not a substitute for G or Phi.
For example, adding equally severe raters may improve Person precision
without removing Person-by-Task variation. An additive MFRM generator does
not acquire that latent interaction simply by increasing facet counts;
a G-study estimates observed-score interaction components, whose scale is
different from a latent interaction variance. Neither method validates
its own assumptions merely by reproducing its own generated data.
These APIs do not fit a joint MFRM/G-theory model. The current simulation
planner uses Person, rater-like and criterion-like roles; changing their
names or level counts does not provide an arbitrary-facet planner. The
multivariate G-study separately supports one or two random measurement
facets. See build_mfrm_sim_spec() and mfrm_g_study() for
the respective design boundaries.
To group persons, raters or tasks by external attributes, use mfrm_features()
followed by mfrm_cluster() with method = "pam" or "hierarchical" for mixed
attributes. mfrm_pca() and clustering with method = "kmeans" use selected numeric
features with explicitly chosen scaling and component counts. See
online feature-analysis guide for imputation and
setting comparisons. These are exploratory attribute groups, not estimated
ability classes or rater-quality judgments.
Use mfrmr_output_guide("features") or mfrmr_output_guide("gtheory") for
their dedicated output routes. Use summary() for reviews and comparisons,
and plot() or plot_data() for fitted PCA, partitions and D-studies.
Save the full analysis with saveRDS(); these are not mfrm_results() inputs.
Export a chosen summary with write.csv(summary(result), ..., row.names = FALSE)
and keep the full source object for its settings, excluded rows and assumptions.
Multivariate G-study component panels/covariance heatmaps, D-study curves,
and paired plan-difference plots return ggplot objects directly and support
as_ggplot() and plot_data(), retaining score identities, G/Phi or SEM,
facet-count panels and unavailable values.
PCA scree/scores/loadings, saved dendrograms, imputation co-membership,
silhouettes and numeric/categorical cluster profiles also return ggplot
objects directly and support as_ggplot(). Use mfrmr_output_guide("plots")
to choose a supported view; data extraction alone does not guarantee equivalent graphics.
Missing scores on assigned ratings
review_mfrm_imputations() reviews supplied ordinal completions;
fit_mfrm_imputed() fits each dataset and retains failures. Inspect every
completion before pool_mfrm_imputed() combines eligible non-Person facet
estimates or prespecified contrasts and their covariance. This route does
not fill unassigned cells or pool Person EAPs. The imputation model and the
fixed-standard-normal RSM/PCM MML analysis must be justified together.
See mfrmr_output_guide("imputation") and
online response-imputation guide for an executed example and its limits.
A pooled result has dedicated summary(), plot() and plot_data() routes;
use saveRDS() for the complete analysis or write.csv(summary(pooled), ...)
for a selected table. It is not an mfrm_results() input. as_ggplot()
supports the saved pooled interval view, including component = "table",
and preserves its t intervals, fixed targets and inference settings.
Use plot_data() for other components; conversion does not refit or pool
the analyses again.
Updating saved analyses for 0.2.4
Keep the original objects, data and analysis settings. Installing an update
does not recalculate saved tables, figures or reports. For analyses based
on a native MFRM fit, start by printing summary(fit) under the updated
package and reading its interpretation
decision. If the saved native fit lacks the current estimation checks,
refit from the original data with the same intended model, category coding,
anchors, weights and numerical settings. Running diagnose_mfrm() alone
cannot establish checks missing from that fit. If the original data or
settings are unavailable, retain the old result as historical output;
its previous approval is not evidence for current inferential use.
Observed-score G/D studies and external-feature groups instead use their
own source objects; they do not require an MFRM fit.
Update the affected result at the earliest step below, then rebuild its dependent summaries, plots and exports. For an MFRM-based analysis, this assumes a fit with current estimation checks. A request to recompute diagnostics or scoring does not itself require a new calibration fit.
Display wording only: reprint a saved fit summary. This updates labels and removes the duplicate inference decision; it does not recalculate stored diagnostics or establish missing precision evidence.
Diagnostics and QC: recreate
diagnose_mfrm()results with the original diagnostic settings before rebuilding reliability, precision, category, marginal-fit, person-fit, unexpected-response, fair-score and reporting results. Rerun separately requestedq3_statistic(),analyze_residual_pca()andcompute_person_fit_indices()calculations with their original options. Inrun_qc_pipeline(), requestseparation_facetsonly for facets whose levels need to be distinguished; it is no longer a default rater-quality requirement. Missing results remain unavailable and cannot be treated as passes.Model comparisons: rerun
compare_mfrm()on the existing eligible fits, retaining the original comparison settings, then rebuild dependentbuild_model_choice_review()andbuild_weighting_review()results. The corrected RSM/PCM nesting review requires every RSM interaction to be retained in the PCM. More category-step parameters do not establish nesting. An affected pair can retain an eligible information-criterion comparison while losing its invalid chi-square test. This correction does not require refitting; printing an old comparison leaves its stored decision unchanged.Group comparisons and equivalence: recreate residual
analyze_dff()/analyze_dff()anddif_interaction_table()results from the existing fit and original group data. They now describe residual differences without tests or confidence intervals. Recomputeanalyze_facet_equivalence()from an eligible MML fit with matching current diagnostics and the original practical bound; old equivalence bundles cannot supply the required joint covariance.ICC and design effects: rerun
compute_facet_icc()oranalyze_hierarchical_structure()from the original data and settings. Numeric score labels now retain their values. Missing scores or grouping values require an explicitmissing = "omit"choice; malformed scores must be corrected. Inspectattr(icc, "data_usage"), then recreatecompute_facet_design_effect()using the new ICC result. Older ICC tables lack the row accounting needed to calculate matching sample sizes. Recalculation also removes the fixed variance cutoff tied to score units and preserves small positive variances without decimal rounding. Constant retained scores have unavailable variance components and ICCs. Design effects remain per-facet approximations; their equivalent row counts do not estimate the precision of a complete crossed or unbalanced design. The formerci_method = "profile"transformed separate component bounds and did not calculate a profile-likelihood interval for the ICC ratio. Choose"boot"explicitly for parametric percentile intervals, then readICC_CI_Statusandattr(icc, "icc_ci"). Failed or nonconverged refits and fit warnings withhold intervals. Saved bootstrap results also require rerunning to obtain complete failure accounting and identify constant-response refits, which withhold intervals; reprinting is insufficient.Observed-score design coefficients and shrinkage: rerun
mfrm_generalizability()with its original data and settings, thenmfrm_d_study()with the planned counts and residual-scaling choice. This re-estimates the separate observed-score mixed model, not the MFRM. Reapplyapply_empirical_bayes_shrinkage()with the original prior settings and explicit Person choice to refresh shrinkage reports, descriptive bands, and replay settings. Reapplication replaces the previous adjustment; switching Person shrinkage off removes its old adjustment columns. Regenerate replay scripts to retain the post-fit adjustment step.Multivariate G/D studies: to apply metric-specific G/Phi/SEM availability rules, rerun
mfrm_d_study()from the saved G-study with the original planned counts and score weights. Changing only future counts or weights also reuses that G-study. Recreate dependent plan comparisons, plots and exports after recalculation; replotting alone preserves stored numbers. Refitmfrm_g_study()when changing the source data or G-study model, replacing an object with missing or incompatible design metadata, or correcting an earlier G-study affected by the single-score MINQUE(0) or period-containing interaction-ID bugs. In particular, a crossed result cannot be converted to a nested model by editing its labels; refit with an explicitnestingspecification. Retain the G-study object and its data to calculate new prespecified plan comparisons withmfrm_multivariate_d_compare(). A coefficient table alone does not contain the information needed for those intervals.External-feature groups: saved clustering results retain their memberships and fitted hierarchy. Replot them to update labels;
plot()returns aggplotobject andplot_data()extracts their stored values. A change to features, weights, group counts or method requires a new clustering call, followed bymfrm_cluster_compare()on the updated results. For imputation comparisons, reuse the originalmiceobject to preserve pairing across completed datasets; do not generate unrelated completions for each setting.Fitted-object Person scores: re-summarize the original prediction object to recover stored interval settings and updated explanations. To replace older grid-endpoint intervals with continuous posterior intervals, rerun
predict_mfrm_units()using the existing fit, scoring data and settings. Reprinting cannot change an already calculated interval. Rerun scoring when older estimated-population results lack numerical prior information or are refused because they claimed unrestricted scoring; these fits require explicitreadiness_policy = "review".Plausible values: use
summary(original_plausible_values)on the saved draw object to obtain empirical quantiles at its requested interval level. No new draws are needed for this correction. A saved derived summary alone cannot recover the original draws. If estimated-population restrictions require regeneration, repeat the original scoring/draw call with the same data, settings and seed, andreadiness_policy = "review".Portable calibration:
load_mfrm_calibration()preserves a valid artifact's recorded scoring algorithm; older grid-based intervals remain grid-based. To adopt continuous intervals, create a new calibration using the reviewed source fits and mfrm_calibration_workflow, then score again. Retain the old artifact for reproducibility. Re-summarizing older score results recovers recorded algorithm/level labels without changing values.External fits: rerun
import_irt_fit()on the saved source-package fit and rebuild displays; source-model re-estimation is unnecessary. Usecompute_fit = TRUEwhen imported measurement diagnostics are needed. Unsupported source models remain unsupported, and imports do not become native fits.Agreement, networks and timing: rebuild
interrater_agreement_table(),rater_network_analysis()andrater_halo_network_analysis()from the existing native fit, matching diagnostics and original settings. Refresh design reviews withbuild_mfrm_network_review()to record whether the graph covers all observed subsets. Recreateresponse_time_review()from the original timed-event data and settings. No MFRM refit is required. Unavailable comparisons remain unassessed; a missing or excluded graph edge does not establish absence of a rater effect. Halo Welch-test columns are retained as missing values. Timing rates use valid times and describe cutoff rules, not calibrated rapid-guessing or low-effort classifications.Simulation and design summaries: re-summarize saved evaluation objects to retain attempted-run denominators and unavailable residual-DIF rates. Rebuilding design summaries also restores unrounded metrics for threshold decisions; rounded saved summaries alone cannot recover that precision. Missing workload or connectivity records cannot be reconstructed by summary formatting. If those records are required for a recommendation, repeat the original evaluation with its recorded design, settings and seeds.
After any required recalculation, regenerate dependent mfrm_results(),
reports and exports with matching source objects. A newly created PDF, HTML
file or CSV can still contain outdated calculations if built from an old
derived object. Consult the affected function's help for its interpretation
limits; updating an object does not broaden those limits.
Next steps for reporting
For ordinary MML/JML mfrm_fit results, use one basic route:
summary(fit) -> res <- mfrm_results(fit) -> summary(res).
The summary's triage and next_actions identify what needs attention;
plot_map lists supported figures. The collector computes missing requested
diagnostics by default. If you already have matching diagnostics, pass them
as diagnostics = diagnostics; compute = "never" keeps absent diagnostics
unavailable rather than computing them. It does not certify readiness.
From res, choose mfrm_report() for a report, plot(res, ...) for a
supported figure, export_mfrm_results() for an analyst archive, or
saveRDS(res, file) for later R use. These are optional branches, not a
checklist that must be run in full. The worked example in
mfrmr_reports_and_tables follows this route. build_apa_outputs() and
build_summary_table_bundle() serve additional manuscript/table assembly;
they are not prerequisites for the ordinary report.
CML and comparison-only fits use their separate structural/comparison
workflow above. For GPCM and extended models, consult mfrm_results()
for the supported sections and attachments before collecting a report.
If an earlier script uses summary(fit, profile = "facets"), reuse its
$results or $results$diagnostics. The historical profile name does not
require FACETS, TAM, or sirt software.
Use JML only when its fixed-person-parameter estimand is methodologically
intended, for example for a JMLE-oriented external comparison, descriptive
or exploratory work, or a design with substantial information per person.
Do not select it merely as a faster substitute for MML: a later MML run
targets a different estimand rather than serving as stricter follow-up to
the same analysis.
Canonical operational review route
When the main question is scale maintenance rather than manuscript reporting,
branch from review$results$diagnostics into:
review_mfrm_anchors() and/or detect_anchor_drift() ->
build_equating_chain() when adjacent-link review is needed ->
build_linking_review() ->
inspect review$group_view_index for stable wave / link / facet rollups and
summary(review)$plot_routes for the next plot helper ->
plot(x) or plot(anchor_review, ...) for the specific flagged
evidence family.
For GPCM, use build_linking_review() as a caveated exploratory
synthesis over direct anchor, drift, and chain evidence. It is not an
operational GPCM linking decision or evidence that anchor drift is absent.
Canonical misfit case-review route
When the main question is which observations, facet levels, or pairwise
structures deserve follow-up, branch from review$results$diagnostics into:
build_misfit_casebook() ->
inspect casebook$group_view_index, casebook$group_views, and
summary(casebook)$plot_routes for stable person / facet / wave rollups and
the next plot helper ->
plot(x, type = "unexpected"), plot(x, type = "displacement"), plot(x, type = "marginal_fit"), or
plot(x, type = "marginal_pairwise") according to casebook$plot_map ->
build_summary_table_bundle() / export_summary_appendix() when the
flagged cases need appendix-style reporting support.
build_misfit_casebook() can still be used for GPCM, but it
should be read as an operational exploratory screen rather than as a strict
Rasch-style invariance report.
Latent-regression route
When the fit uses population_formula = ..., keep the distinction between
the estimator and the forecast helpers explicit:
fit_mfrm()estimates the current narrow latent-regressionMMLbranch. In the returned fit object,fit$population$person_tableis the complete-case estimation table, whilefit$population$person_table_replayretains the observed-person-aligned pre-omit background-data table for replay/export provenance.predict_mfrm_units()andsample_mfrm_plausible_values()can then score under the fitted population model when scored units also supply one-row-per-person background data. That scoring-timeperson_datacontract remains separate from the fit object's stored replay table. Estimated-population scoring currently requires explicitreadiness_policy = "review". Scores and intervals hold the estimated calibration and population parameters fixed; their estimation uncertainty is omitted. These draws alone do not justify downstream group comparisons or regression without a compatible conditioning model and sampling design.predict_mfrm_population()remains a scenario-level simulation/refit helper rather than the latent-regression estimator itself.
Score-category support
If the intended rating scale includes categories not observed in the current
data, make that support explicit. For example, use
rating_min = 1, rating_max = 5 for a 1-5 scale with only 2-5 observed.
This preserves the declaration in the data-support review. A zero-count
boundary is review evidence for the separate element-boundary contract; it
is not by itself an unsupported free-step contrast.
If an intermediate category is unobserved (for example 1, 2, 4, 5 with no
3), also set category_policy = "preserve" if the zero-count category should remain
in the fitted support. summary(describe_mfrm_data(...)) reports retained
zero-count categories in Notes, printed Caveats, and $caveats;
summary(fit) carries full structured rows into printed Caveats and
$caveats, with Key warnings as a short triage subset. Summary-table
exports route those rows through score_category_caveats or
analysis_caveats. In a polytomous fitted ladder, a retained zero-count
internal category creates an unsupported adjacent-step contrast and stops
fitting before optimization.
Planned assignment and structural missingness
A long-format table alone does not reveal whether an absent Person x facet
cell was expected or never assigned. When a score-free assignment roster is
available, pass it as expected_design to describe_mfrm_data(). The
summary then separates expected-but-unobserved cells from unexpected
observations and reports observed versus declared Person-facet graph
components. Without a roster, structural missingness is explicitly marked
as not assessed; mfrmr does not assume a complete crossing.
Typical workflow
The steps below describe ordinary MML/JML mfrm_fit results. Native CML
uses the separate route in From the first summary to diagnostics:
read its structural or comparison summary, create mfrm_facet_intervals(),
and use the interval object's plots/tables and RDS saving. CML has no Person
abilities or population SD and does not support the ordinary diagnostic,
Wright-map or consolidated-report steps. mfrmr_output_guide("intervals") also maps
full MML interaction contrasts and their explicit population-SD standardization.
Review the long-format data and intended score support with
describe_mfrm_data().Fit a model with
fit_mfrm(). ChooseMMLorJMLfrom the prespecified estimand and assumptions; do not selectJMLmerely to shorten runtime.Read
summary(fit)$decision. For a usable ordinary fit, collectres <- mfrm_results(fit)and inspectsummary(res)$triageand$next_actions. The sameressupports reporting and saving; use$plot_mapto select an optional figure.(Optional) Use
run_mfrm_facets()orrun_mfrm_facets()only when a legacy-compatible one-shot wrapper is needed.For a focused diagnostic question, reuse
res$diagnostics. Calldiagnose_mfrm()separately when its settings need to change. For final reporting, preferdiagnostic_mode = "both"so the legacy residual path and the strict marginal screen remain visible side by side. ForGPCM, diagnostics are now available throughdiagnose_mfrm()together withanalyze_residual_pca(),interrater_agreement_table(),unexpected_response_table(),displacement_table(),measurable_summary_table(),rating_scale_table(),facet_quality_dashboard(),reporting_checklist(), and plot(x, type = "qc") – the fair-average panel of the dashboard reports an explicit unavailability indicator under GPCM. Usefair_average_table()directly when you need the supported slope-aware element-conditional fair averages. Treat those residual-based summaries as exploratory screens because the discrimination parameter is free. Full FACETS-style score-side contract review remains blocked forGPCM; package-native scorefile export, fit-based reporting bundles, direct fair-average tables, and bias-screening tables carry their own caveats. Posterior scoring withpredict_mfrm_units()/sample_mfrm_plausible_values(), design-weighted information viacompute_information()/ plot(x), Wright/pathway/CCC plots viaplot.mfrm_fit(), direct category reports viacategory_structure_report()/category_curves_report(), and direct data generation throughbuild_mfrm_sim_spec(),extract_mfrm_sim_spec(), andsimulate_mfrm_data()are also available when the simulation specification stores both thresholds and slopes. Usesimulate_mfrm_recovery()andassess_mfrm_recovery()for direct recovery checks plus caveated role-based design evaluation, population forecasting, diagnostic-screening, and signal-detection helpers. Caveated APA/QC/export bundles are available for sensitivity reporting, while score-side FACETS helpers remain outside the documentedGPCMboundary. Usemfrmr_output_guide("gpcm_capabilities")(and mfrmr_gpcm_scope) as the formal capability map before branching into less common helpers. Residual DIF/DFF differences remain descriptive; their detection and false-positive rates are unavailable inevaluate_mfrm_signal_detection(). To evaluate your own declared rater-warning procedure against known simulation truth, usemfrm_screening_performance()with a complete planned roster. It distinguishes individual and any-target rates, Monte Carlo uncertainty and unavailable outcomes. See online screening-performance guide.(Optional,
RSM/PCM;GPCMwith caveat) Estimate interaction bias withestimate_bias().Choose a downstream branch:
reporting_checklist()for direct report preparation, orbuild_weighting_review()for Rasch-versus-GPCMweighting review, orbuild_misfit_casebook()/build_linking_review()for operational case review. ForGPCM, usebuild_linking_review()only as an exploratory index over direct anchor/drift/chain evidence.For ordinary reports and saving, use
mfrm_report(),export_mfrm_results()orsaveRDS(res, file). For additional manuscript and appendix assembly, select the relevant helper:build_summary_table_bundle(),apa_table(),export_summary_appendix(),build_fixed_reports(),build_visual_summaries(). ForGPCM, use the APA, visual, QC, and fit-based export bundles as caveated sensitivity-reporting surfaces; full score-side FACETS review stays blocked, while diagnostic/signal-detection design screening has its own caveated operating-characteristic route.(Optional,
RSM/PCM) Review report completeness withreference_case_review(). Usefacets_output_contract_review()only when you explicitly need the compatibility layer.(Optional,
RSM/PCM) For operational linking follow-up, combinereview_mfrm_anchors(),detect_anchor_drift(), andbuild_equating_chain()insidebuild_linking_review()before exporting appendix-style tables.(Optional) Check packaged reference cases with
reference_case_benchmark()when you want package-side reference checks.(Optional) For design planning or future scoring, move to the simulation/prediction layer:
build_mfrm_sim_spec()/extract_mfrm_sim_spec()->simulate_mfrm_recovery()->assess_mfrm_recovery()/evaluate_mfrm_design()/predict_mfrm_population()->predict_mfrm_units()/sample_mfrm_plausible_values(). Current fit-derived simulation specs include directGPCMdata generation and recovery checks. Design-evaluation, population-forecasting, diagnostic- screening, and signal-detection helpers also supportGPCMas caveated role-based simulation/refit evidence; inspectgpcm_boundarybefore using those results in design claims. Unit scoring can use an ordinaryMMLfit directly, a latent-regressionMMLfit when you also supply one-row-per-person background data for the scored units, or aJMLfit when a post hoc reference-prior EAP layer is acceptable. Estimated-population fits require explicitreadiness_policy = "review"; this does not remove their interpretation limits. Intercept-only latent-regression fits (population_formula = ~ 1) can reconstruct that minimal person table from the scored person IDs. Keeppredict_mfrm_population()conceptually separate from that scoring layer: it is a simulation-based scenario forecast helper, not the latent-regression estimator itself. Prediction export still requires actual prediction objects in addition toinclude = "predictions".Use
summary()for compact text checks andplot()forggplot2visual diagnostics (extracting tables and cautions withplot_data()).
Three practical routes
Quick first pass:
RSM/PCM:fit_mfrm()->diagnose_mfrm()-> plot(x, type = "qc") ->reporting_checklist()when you want the package to route the next figures.GPCM:fit_mfrm()->diagnose_mfrm()-> plot(x, type = "qc") /unexpected_response_table()->rating_scale_table()->compute_information()-> plot(x) ->plot.mfrm_fit()/category_curves_report()->fair_average_table()/estimate_bias()when those screening tables answer the question. ForGPCM, the fit-based export family (build_mfrm_manifest(),build_mfrm_replay_script(),export_mfrm_bundle()) is available as caveated sensitivity-reporting output with explicitgpcm_boundaryrows.Linking and coverage review:
subset_connectivity_report()->plot(..., type = "design_matrix")-> plot(x, type = "wright", view = "unified").Manuscript prep:
RSM/PCM:reporting_checklist()-> inspect the"Visual Displays"and"Method Section"rows ->build_apa_outputs()->build_summary_table_bundle()->apa_table()orexport_summary_appendix().GPCM:reporting_checklist()-> direct table/plot helpers ->build_apa_outputs()/build_visual_summaries()->export_mfrm_bundle()withgpcm_boundarycaveats.Weighting-policy review:
compare_mfrm()->build_weighting_review()->compute_information()/ plot(x) when you want to inspect whetherGPCMis introducing substantively acceptable discrimination-based reweighting relative to the Rasch-family reference. Eligible MML comparisons require a common grid of at least 31 points and a denser common-grid sensitivity check when close or consequential. GPCM MML ranking requires the separate likelihood and solution checks;nested = TRUEadditionally checks the PCM/GPCM equal-slope test;confint.mfrm_fit()withparm = "slopes"separately checks approximate slope intervals, with explicit standardized-scale, contrast, sandwich and Bonferroni options.bootstrap_mfrm_gpcm()supplies a fitted-model bootstrap alternative;mfrm_curve_intervals()adds uncertainty to probabilities and per-rating information.mml_quadrature_sensitivity()preserves explicit population covariates and reports interval changes across grids. Attach the explicitly selected intervals withmfrm_results(fit, intervals = list(slopes = ci)); plot viatype = "gpcm_slopes"or useapa_table()andplot_data(). Saved reports/exports retain methods and targets without refitting.Design planning and forecasting:
build_mfrm_sim_spec()orextract_mfrm_sim_spec()->simulate_mfrm_recovery()->assess_mfrm_recovery()for parameter-recovery checks, thenevaluate_mfrm_design()->predict_mfrm_population()->predict_mfrm_units()orsample_mfrm_plausible_values()under the fitted scoring basis (ordinaryMML, latent-regressionMMLwith person-level background data, orJMLwith the documented post hoc EAP approximation). Here again,predict_mfrm_population()is the scenario-level forecast helper, whereaspredict_mfrm_units()/sample_mfrm_plausible_values()are the scoring layer. Prediction export requires actual prediction objects.GPCMsupports direct data generation viabuild_mfrm_sim_spec(),extract_mfrm_sim_spec(), andsimulate_mfrm_data(),simulate_mfrm_recovery(),assess_mfrm_recovery(), caveated role-based design evaluation and population forecasting, diagnostic/signal-detection design screening, residual diagnostics, and direct curve/report helpers. The current planning layer remains role-based for two non-person facets even though estimation itself supports arbitrary facet counts. Additional arbitrary-facet fields are structural design metadata, not Monte Carlo performance results.
Interpreting output
This help page is a map, not an estimator:
use it to decide function order,
identify when dedicated helper functions are needed,
and treat
reporting_checklist()as the package's readiness router for plot and report follow-up.
Objects with default summary() and plot() routes
mfrm_fit:summary(fit)andplot(fit, ...).mfrm_diagnostics:summary(diag); plotting via dedicated helpers such as plot(x, type = "unexpected"), plot(x, type = "displacement"), plot(x, type = "qc").mfrm_bias:summary(bias)and plot(x, type = "bias").mfrm_data_description:summary(ds)andplot(ds, ...).mfrm_anchor_review:summary(review)andplot(review, ...).mfrm_misfit_casebook:summary(casebook)andprint(casebook), with grouping views available throughcasebook$group_view_indexandcasebook$group_views, source-specific plotting routed throughsummary(casebook)$plot_routesandcasebook$plot_map, and appendix/report handoff available throughbuild_summary_table_bundle()andexport_summary_appendix().mfrm_weighting_review:summary(review)andprint(review), with information follow-up routed throughcompute_information()and plot(x) according toreview$plot_map, and appendix/report handoff available throughbuild_summary_table_bundle()andexport_summary_appendix().mfrm_linking_review:summary(review)andprint(review), with grouping views available throughreview$group_view_indexandreview$group_views, and plotting routed throughsummary(review)$plot_routes, plot(x), andplot(anchor_review, ...)according toreview$plot_map.mfrm_facets_run:summary(run)andplot(run, type = c("fit", "qc"), ...).apa_table:summary(tbl)andplot(tbl, ...).mfrm_apa_outputs:summary(apa)for compact diagnostics of report text.mfrm_summary_table_bundle:print(bundle)for manuscript-oriented table index plus named tables from supportedsummary()outputs,summary(bundle)for table-role/numeric coverage, andplot(bundle, ...)for table-size or numeric-column QC.mfrm_threshold_profiles:summary(profiles)for preset threshold grids.mfrm_population_prediction:summary(pred)for design-level forecast tables.mfrm_unit_prediction:summary(pred)for unit-level posterior summaries under the fitted scoring basis.mfrm_plausible_values:summary(pv)for draw-level uncertainty summaries.mfrm_bundlefamilies:summary()and class-awareplot(bundle, ...). Key bundle classes now also use class-awaresummary(bundle):mfrm_unexpected,mfrm_fair_average,mfrm_displacement,mfrm_interrater,mfrm_facets_chisq,mfrm_bias_interaction,mfrm_rating_scale,mfrm_category_structure,mfrm_category_curves,mfrm_measurable,mfrm_unexpected_after_bias,mfrm_output_bundle,mfrm_residual_pca,mfrm_specifications,mfrm_data_quality,mfrm_iteration_report,mfrm_subset_connectivity,mfrm_facet_statistics,mfrm_facets_contract_review,mfrm_reference_review,mfrm_reference_benchmark.
plot.mfrm_bundle() coverage
Default dispatch now covers:
mfrm_unexpected,mfrm_fair_average,mfrm_displacementmfrm_interrater,mfrm_facets_chisq,mfrm_bias_interactionmfrm_bias_count,mfrm_fixed_reports,mfrm_visual_summariesmfrm_category_structure,mfrm_category_curves,mfrm_rating_scalemfrm_measurable,mfrm_unexpected_after_bias,mfrm_output_bundlemfrm_residual_pca,mfrm_specifications,mfrm_data_qualitymfrm_iteration_report,mfrm_subset_connectivity,mfrm_facet_statisticsmfrm_facets_contract_review,mfrm_reference_review,mfrm_reference_benchmark
For unknown bundle classes, use dedicated plotting methods or custom
ggplot2 displays built from component tables via plot_data().
Examples
# Load the package
library(mfrmr)
# Load example ratings and look at the first six rows
ratings <- load_mfrmr_data("example_operational")
head(ratings)
#> Study Person Rater Criterion Score Group
#> 1 OperationalExample P001 R01 Language 4 A
#> 2 OperationalExample P001 R01 Organization 2 A
#> 3 OperationalExample P001 R02 Content 4 A
#> 4 OperationalExample P001 R02 Language 3 A
#> 5 OperationalExample P001 R02 Organization 2 A
#> 6 OperationalExample P002 R01 Content 3 A
# Fit the model
fit <- fit_mfrm(
data = ratings,
person = "Person",
facets = c("Rater", "Criterion"),
score = "Score",
rating_min = 1, rating_max = 4, category_policy = "preserve",
method = "MML",
model = "RSM",
population_formula = NULL # Fixed N(0,1) ability distribution
)
# Plot the results (Wright map)
plot(fit)
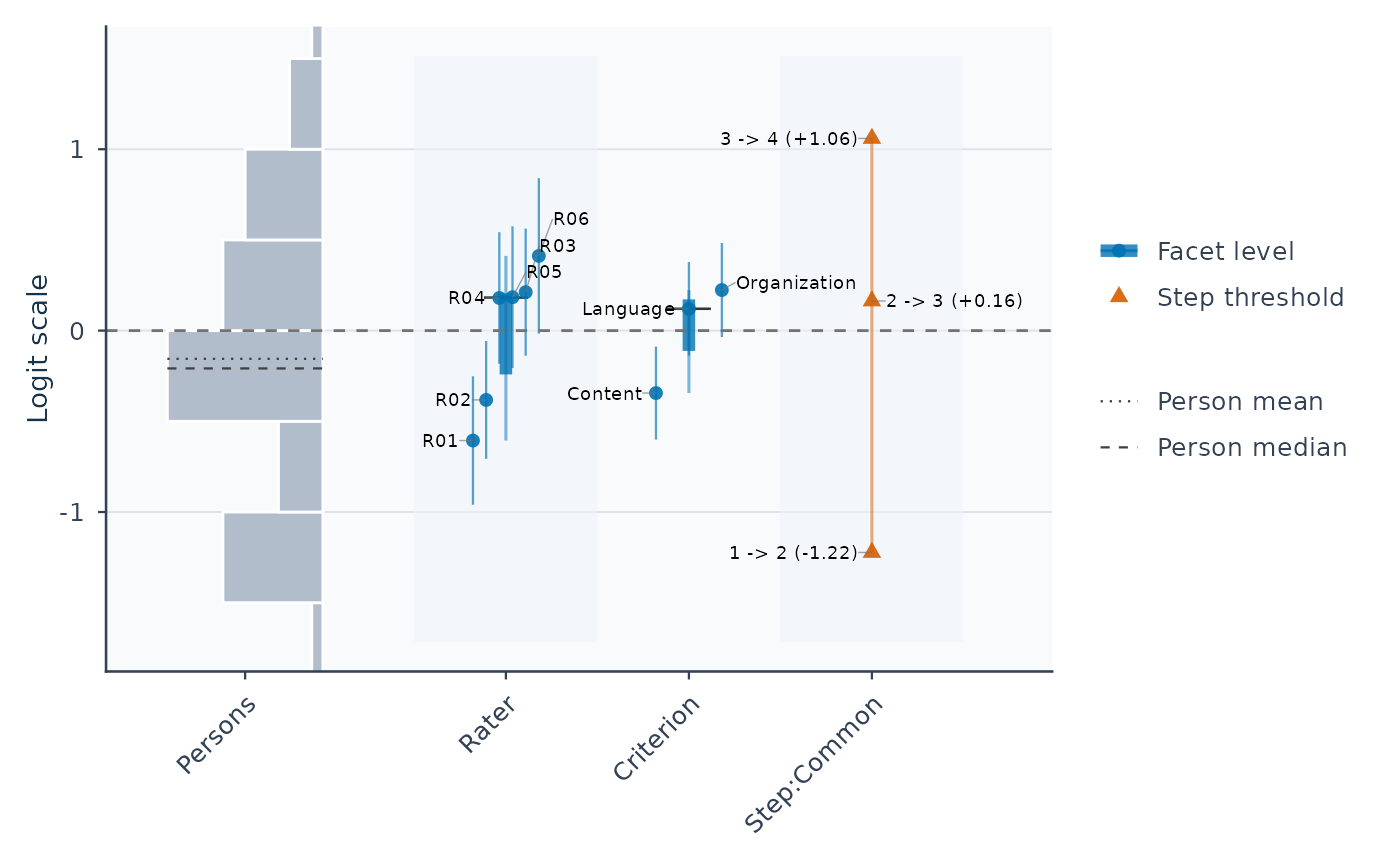 # Save the summary, then display its tables
results <- summary(fit)
results$person_overview # One row summarizing person ability estimates
#> # A tibble: 1 × 11
#> Persons DistributionN ReviewExcludedExtremeE…¹ EstimateUse Mean SD Median
#> <int> <int> <int> <chr> <dbl> <dbl> <dbl>
#> 1 48 48 0 source_fit… -0.155 0.824 -0.208
#> # ℹ abbreviated name: ¹ReviewExcludedExtremeEAPs
#> # ℹ 4 more variables: Min <dbl>, Max <dbl>, Span <dbl>, MeanPosteriorSD <dbl>
results$facet_overview # One row per facet: number of levels, mean, SD, range
#> # A tibble: 2 × 7
#> Facet Levels MeanEstimate SDEstimate MinEstimate MaxEstimate Span
#> <chr> <int> <dbl> <dbl> <dbl> <dbl> <dbl>
#> 1 Criterion 3 0 0.302 -0.344 0.224 0.568
#> 2 Rater 6 -4.64e-18 0.399 -0.606 0.412 1.02
# Check the interpretation status and recommended next step
results$decision
#> Interpretation
#> 1 Fit-readiness requirements satisfied; formal precision review required
#> FormalInference FitReadiness
#> 1 No ready
#> Why
#> 1 Formal precision support has not been evaluated. These checks assess numerical readiness and the requested precision method under the specified model; they do not establish model adequacy or finite-sample coverage for this design.
#> NextAction
#> 1 Run `diagnose_mfrm()` and pass its result as `diagnostics =` to evaluate formal precision support; fit readiness alone is not a formal-inference decision.