
Plot inter-rater agreement diagnostics using base R
Source:R/api-plotting.R
plot_interrater_agreement.RdPlot inter-rater agreement diagnostics using base R
Usage
plot_interrater_agreement(
  x,
  diagnostics = NULL,
  rater_facet = NULL,
  context_facets = NULL,
  exact_warn = 0.5,
  corr_warn = 0.3,
  plot_type = c("exact", "corr", "difference"),
  top_n = 20,
  main = NULL,
  palette = NULL,
  label_angle = 45,
  preset = c("standard", "publication", "compact", "monochrome"),
  draw = TRUE,
  title = NULL
)
Arguments
- x
Output from
fit_mfrm()orinterrater_agreement_table().- diagnostics
Optional output from
diagnose_mfrm()whenxismfrm_fit.- rater_facet
Name of the rater facet when
xismfrm_fit.- context_facets
Optional context facets when
xismfrm_fit.- exact_warn
Warning threshold for exact agreement.
- corr_warn
Warning threshold for pairwise correlation.
- plot_type
"exact","corr", or"difference".- top_n
Maximum pairs displayed for bar-style plots.
- main
Compatibility title argument. Omitted or
NULLkeeps the default title. Existing calls remain supported without a deprecation warning. For new code, prefertitle; do not supply both arguments.- palette
Optional named color overrides (
ok,flag,expected).- label_angle
X-axis label angle for bar-style plots.
- preset
Visual preset (
"standard","publication","compact", or"monochrome").- draw
If
TRUE, draw with base graphics.- title
Plot title. Omit it to keep the default, supply one character string to replace it, or use
NULL(or"") to suppress it. This changes only the heading; numerical results, reference lines, subtitles and interpretation notes remain. Bothmainandtitleexplicitly supplied is an error, even if equal orNULL. Positional legacy arguments retain their order; use the exact nametitle.
Details
Inter-rater agreement plots summarize pairwise consistency for a chosen rater facet. Agreement statistics are computed over observations that share the same person and context-facet levels, ensuring that comparisons reflect identical rating targets.
Exact agreement is the proportion of matched observations where both raters assigned the same category score. The expected agreement line shows the proportion expected under the fitted model, averaging products of category probabilities over matched rating contexts. It is a model-based baseline, not a chance-corrected agreement coefficient.
Pairwise correlation is the Pearson correlation between scores assigned by each rater pair on matched observations.
The difference plot describes directional score differences (mean signed difference on x-axis: positive = Rater 1 assigned higher scores) and total inconsistency (mean absolute difference on y-axis). Points near the origin indicate both small mean differences and low inconsistency.
The context_facets parameter specifies which facets define "the
same rating target" (e.g., Criterion). When NULL, all non-rater
facets are used as context.
Plot types
"exact"(default)Bar chart of exact agreement proportion by rater pair. Expected agreement overlaid as connected circles. Horizontal reference line at
exact_warn. Bars colored red when observed agreement falls below the warning threshold."corr"Bar chart of pairwise Pearson correlation by rater pair. Reference line at
corr_warn. Ordered by correlation (lowest first). Low correlations suggest inconsistent rank ordering of persons between raters."difference"Scatter plot. X-axis: mean signed score difference (Rater 1 \(-\) Rater 2); positive values indicate Rater 1 assigned higher scores. This observed-score contrast is distinct from the fitted rater-severity parameter. Y-axis: mean absolute difference (overall disagreement magnitude). Points colored red when flagged. Vertical reference at 0.
Interpreting output
Pairs below exact_warn and/or corr_warn should be prioritized for
rater calibration review. On the difference plot, points far from the
origin along the x-axis indicate directional score differences; points high on the
y-axis indicate large inconsistency regardless of direction.
Typical workflow
Select rater facet and run
"exact"view.Confirm with
"corr"view.Use
"difference"to inspect directional disagreement.
Further guidance
For a plot-selection guide and a longer walkthrough, see
mfrmr_visual_diagnostics and
vignette("mfrmr-visual-diagnostics", package = "mfrmr").
Session plot defaults
Set options(mfrmr.plot_preset = "publication") to choose a session default
for plotting functions that expose the common preset argument. The
supported values are "standard", "publication", "compact" and
"monochrome". Precedence is an explicit call argument, then the session
option, then "standard". For example, preset = "standard" overrides
a session set to "monochrome". Explicit preset = NULL retains the
earlier package-default behavior; it does not read the session option.
Invalid session values cause an error only when that option is needed.
The category-curve, data-quality, fit-review, connectivity and network
routes of plot() for report bundles use the same option through ....
Plots without a common preset argument, including extended-model plots
with their own palette controls, keep their own settings. This option
selects a preset, not a universal theme or a guarantee that all renderers
implement every appearance control identically.
New plot payloads retain the resolved preset for supported saved-data
rendering. Converting an existing payload with as_ggplot() uses its saved
appearance, even after the session option changes. A call that creates a
new plot from a fit or statistical result uses the current default.
For a reproducible script, supply preset explicitly or set the option in
that script. Saving only the fitted model does not save a session option.
No global ggplot theme is changed.
Restore previous settings with old <- options(mfrmr.plot_preset = "monochrome") followed by options(old). Use
options(mfrmr.plot_preset = NULL) to remove the option. The preset changes
appearance, not estimates, confidence levels or diagnostic thresholds.
Examples
# \donttest{
# Load the package and example ratings
library(mfrmr)
toy <- load_mfrmr_data("example_operational")
# Fit the model
fit <- fit_mfrm(
data = toy,
person = "Person",
facets = c("Rater", "Criterion"),
score = "Score",
method = "MML",
model = "RSM"
)
# Compare observed exact agreement with its model-expected baseline
plot_interrater_agreement(fit, rater_facet = "Rater")
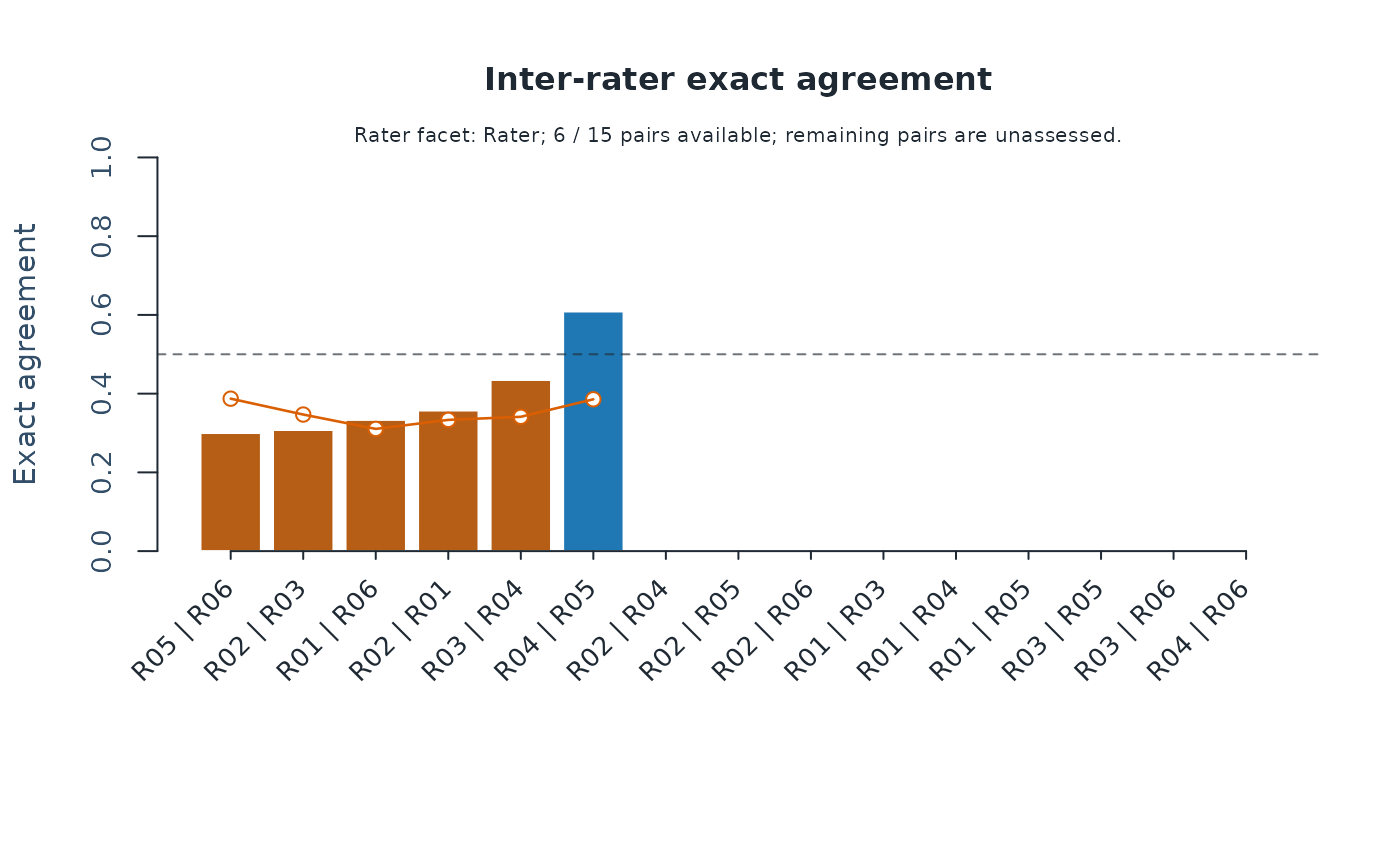 # Bars show observed agreement; connected circles show model-expected agreement
# Optional: compare the direction and magnitude of observed-score differences
plot_interrater_agreement(fit, rater_facet = "Rater", plot_type = "difference")
# Bars show observed agreement; connected circles show model-expected agreement
# Optional: compare the direction and magnitude of observed-score differences
plot_interrater_agreement(fit, rater_facet = "Rater", plot_type = "difference")
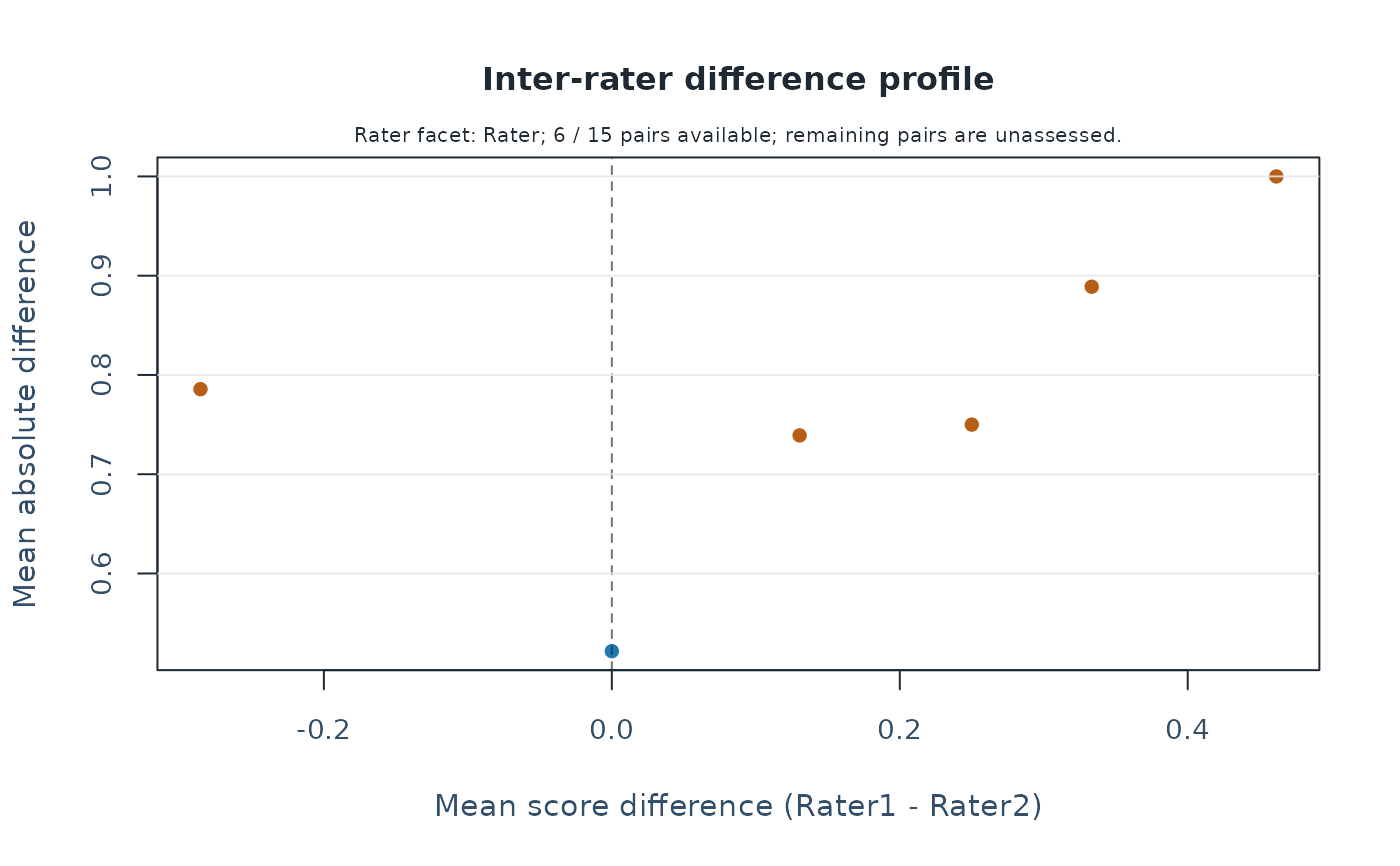 # Positive horizontal values mean Rater1 assigned higher scores than Rater2
# }
# Positive horizontal values mean Rater1 assigned higher scores than Rater2
# }