
Plot criteria behind a design recommendation
Source:R/api-design-recommendation.R
plot.mfrm_design_recommendation.RdPlot criteria behind a design recommendation
Usage
# S3 method for class 'mfrm_design_recommendation'
plot(x, draw = TRUE, ...)
Arguments
- x
Output from
recommend_mfrm_design().- draw
Logical; draw the criterion-status matrix. Use
FALSEto retrieve every criterion and source table without drawing.- ...
Unused; extra arguments are rejected.
Value
An invisible mfrm_plot_data with table (long criterion outcomes),
designs, targets, thresholds and interpretation notes.
Details
Columns are ranked candidates, labelled by DesignRow; an asterisk
marks the selected candidate. Rows combine the facet and criterion.
Grey means unavailable and white means not requested, neither a passing
result. Selection follows the stored ordering, not a new utility function.
For custom ggplot/raincloud graphics, use plot_data(x, "table") or obtain
full design metrics with plot_data(x, "designs", format = "long", value_cols = c("MinReliability", "MaxRatings")). These aggregate metrics
are not replication-level distributions for a raincloud plot.
Examples
saved <- readRDS(system.file("examples", "simulation-design.rds",
package = "mfrmr", mustWork = TRUE))
rec <- recommend_mfrm_design(saved$result, facets = "Person")
plot(rec)
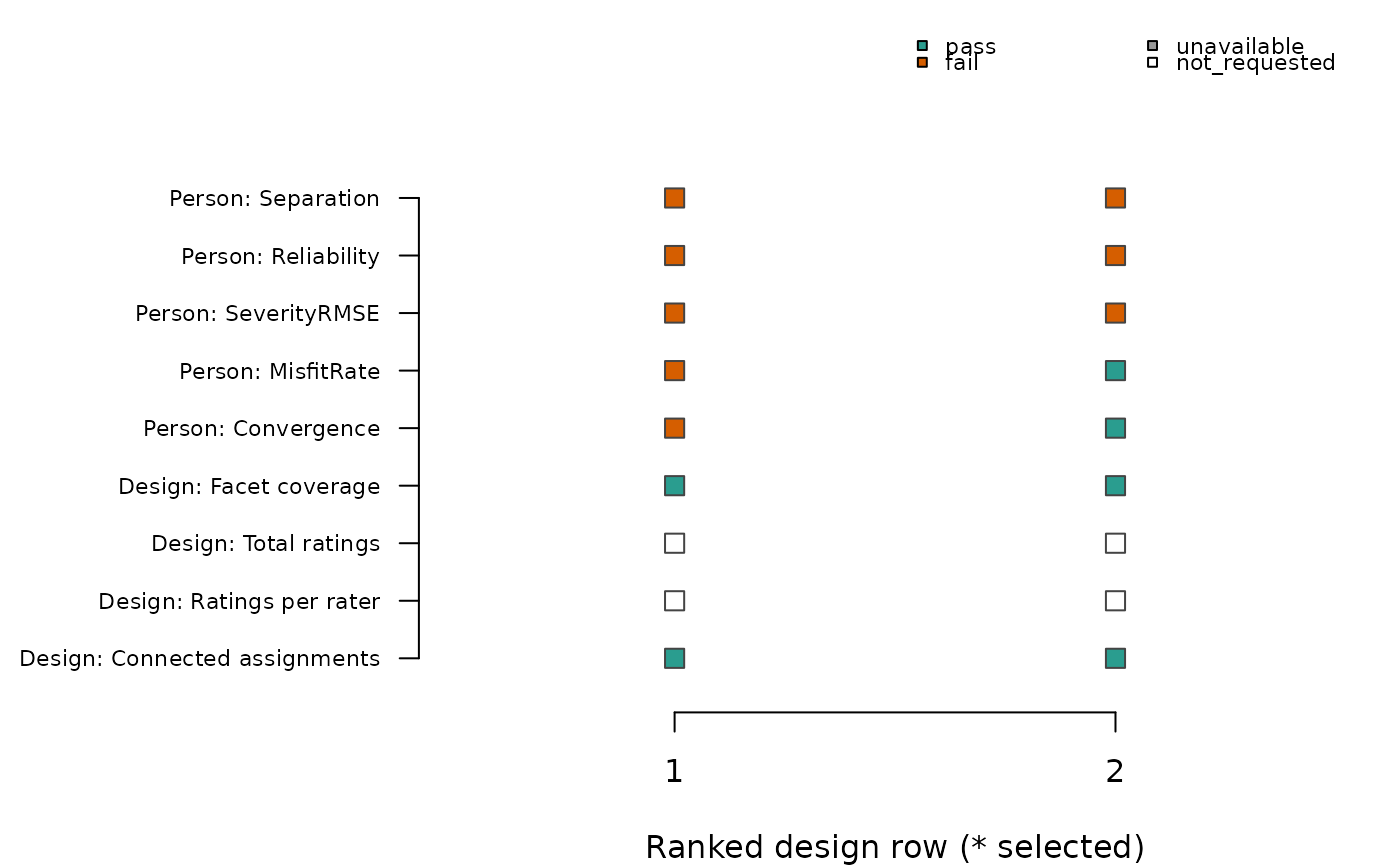 head(plot_data(rec, "table"))
#> DesignRow Facet Criterion Value Relation Threshold Status
#> 1 1 Person Separation 1.1335399 >= 2.0 fail
#> 2 2 Person Separation 1.5524611 >= 2.0 fail
#> 3 1 Person Reliability 0.5623465 >= 0.8 fail
#> 4 2 Person Reliability 0.7067565 >= 0.8 fail
#> 5 1 Person SeverityRMSE 1.2020555 <= 0.5 fail
#> 6 2 Person SeverityRMSE 0.6882577 <= 0.5 fail
#> Check
#> 1 Person: Separation
#> 2 Person: Separation
#> 3 Person: Reliability
#> 4 Person: Reliability
#> 5 Person: SeverityRMSE
#> 6 Person: SeverityRMSE